This article is part of the Security Tech Blog Series: Spring Cleaning for Security, brought to you by David from the Security Engineering team. We hope this article can provide you with some useful pointers to kickstart your journey in threat detection, and get familiar with Mercari’s own SOC (security operations center) initiatives.
Introduction
In general, cyber security can be broken down into three core principles: prevention, detection and response. In recent blog posts and online talk events the Security Team and Microservices Platform Team, have mainly touched on the prevention side [1] of security. In this article I would like to shift the focus onto detection and also delve a little into response.
Prevention plays a critical role in reducing overall risk and protecting Mercari from cyber threats. However, no prevention strategy is perfect, and adamant adversaries will be persistent in trying various techniques to eventually overcome even the best of defenses. As a result, it is imperative that we can detect adversaries as quickly as possible. Strong detection capabilities can help us remediate issues and eradicate adversaries before they have a chance to gain a foothold in the organization, and before they can reach critical data and systems.
The days where a NIDS (Network Intrusion Detection System) as a portcullis protecting the castle and simple malware detection software on endpoint devices were sufficient are long gone. Nowadays, data is more decentralized than ever, infrastructure is ephemeral and running on the cloud, virtual workspaces are everywhere, and there has been an exponential increase in the number of cloud applications and APIs that make up the infrastructure of organizations, with Mercari being no exception to this trend. Knowing what to monitor and how to go about it can be a real challenge.
A “decentralized” security operation center (SOC)
Traditionally, establishing a SOC has been one common way to tackle this challenge. However, there is an ongoing shift in that industry, with many similarities to what happened to the IT industry with the DevOps and SRE transformation. At Mercari, there are no analysts in tiered levels in our SOC. Instead, we have detection engineers, who architect and manage our security monitoring capabilities. Detection engineering focuses on outcomes, efficiency, and improving skills in threat intelligence and threat hunting. An example of this kind of SOC model has already been explained in brilliant detail by Google in their whitepaper "Autonomic Security Operations”
At Mercari, we have a strong engineering culture and a “Go Bold” attitude. In alignment with this, we set our vision to build a modern SOC with the following goals in mind:
- Monitoring using cloud workloads and cloud native infrastructure
- Control on the data pipeline, from ingestion, parsing, and normalization, all running at scale
- Flexibility with custom built tools that are meaningful and easily adaptable. No vendor lock-in
- A data lake without retention limits, for security telemetry, analytics, and investigations
- Empower people and creativity. Fight sophisticated threats. Limit the need for manual triage of alerts
Detection Engineering
The core idea of detection engineering is to approach threat detection in the same way we approach developing software. This means writing detection rules and processes in a programming language, adopting test-driven development, utilizing a version control system, peer-review of changes, and automation of deployments using a CI/CD workflow.
Detection engineers go beyond simply being software engineers; they are experts in attack techniques, threat modeling, threat intelligence, threat hunting, and incident response. They measure the effectiveness and coverage of detection capabilities related to risks inherent to the organization and they continuously reevaluate and improve these capabilities based on the ever-changing threat landscape. Detection engineers need to be able to answer questions like:
- What are the threats that we need to detect?
- What can we detect with the current capabilities and technologies we have in place?
- Are we really able to detect these threats?
- How good are we at detecting threats?
- Do we provide proper remediation and response for detected threats?
At Mercari, detection engineers are the principal members of the SOC, they hold the “detect” and “respond” roles, with the responsibility of technical incident response being shared together with the CSIRT (computer security incident response team) for incident response coordination.
Building a monitoring platform: SOAR
At the heart of any SOC lies their monitoring platform. The features and capabilities that we aim to equip our monitoring platform with at Mercari closely match the definition for SOAR (Security Orchestration, Automation and Response), a term coined by Gartner, they describe it as:
“Technologies that enable organizations to take inputs from a variety of sources and apply workflows aligned to processes and procedures. These can be orchestrated via integrations with other technologies and automated to achieve the desired outcome and greater visibility. [they] enhance security operations activities like threat detection and response by providing machine-powered assistance to human analysts to improve the efficiency and consistency of people and processes.”.
While some vendors on the market provide SIEM (Security Information and Event Management) and SOAR solutions with point and click frontends, they often have limitations on available integrations, require the use of proprietary query languages, and have expensive licensing fees. As a result, these tools can’t achieve the kind of goals we stated for our SOC above.
So how did we architect our own in-house SOAR platform at Mercari? In the next section, I will explain this in detail with some examples. We hope the information will be of some value and give you ideas on how to implement a similar solution in your own organization.
Architecture
The main philosophy of our solution was to build it using the same or similar technology stack used by software engineers at Mercari. This way we could share knowledge across teams easily and stay up to date with the latest technologies in use across the organization. For us this means (but is not limited to):
- Building using microservices and serverless concepts
- Centralizing our development around the Go programming language and its toolset
- Building and deploying using DevOps, SRE, IaC and CI/CD best practices
- Using Open-Source Software and Cloud Native Computing Foundation (CNCF) projects
- Running workloads on the Google Cloud Platform
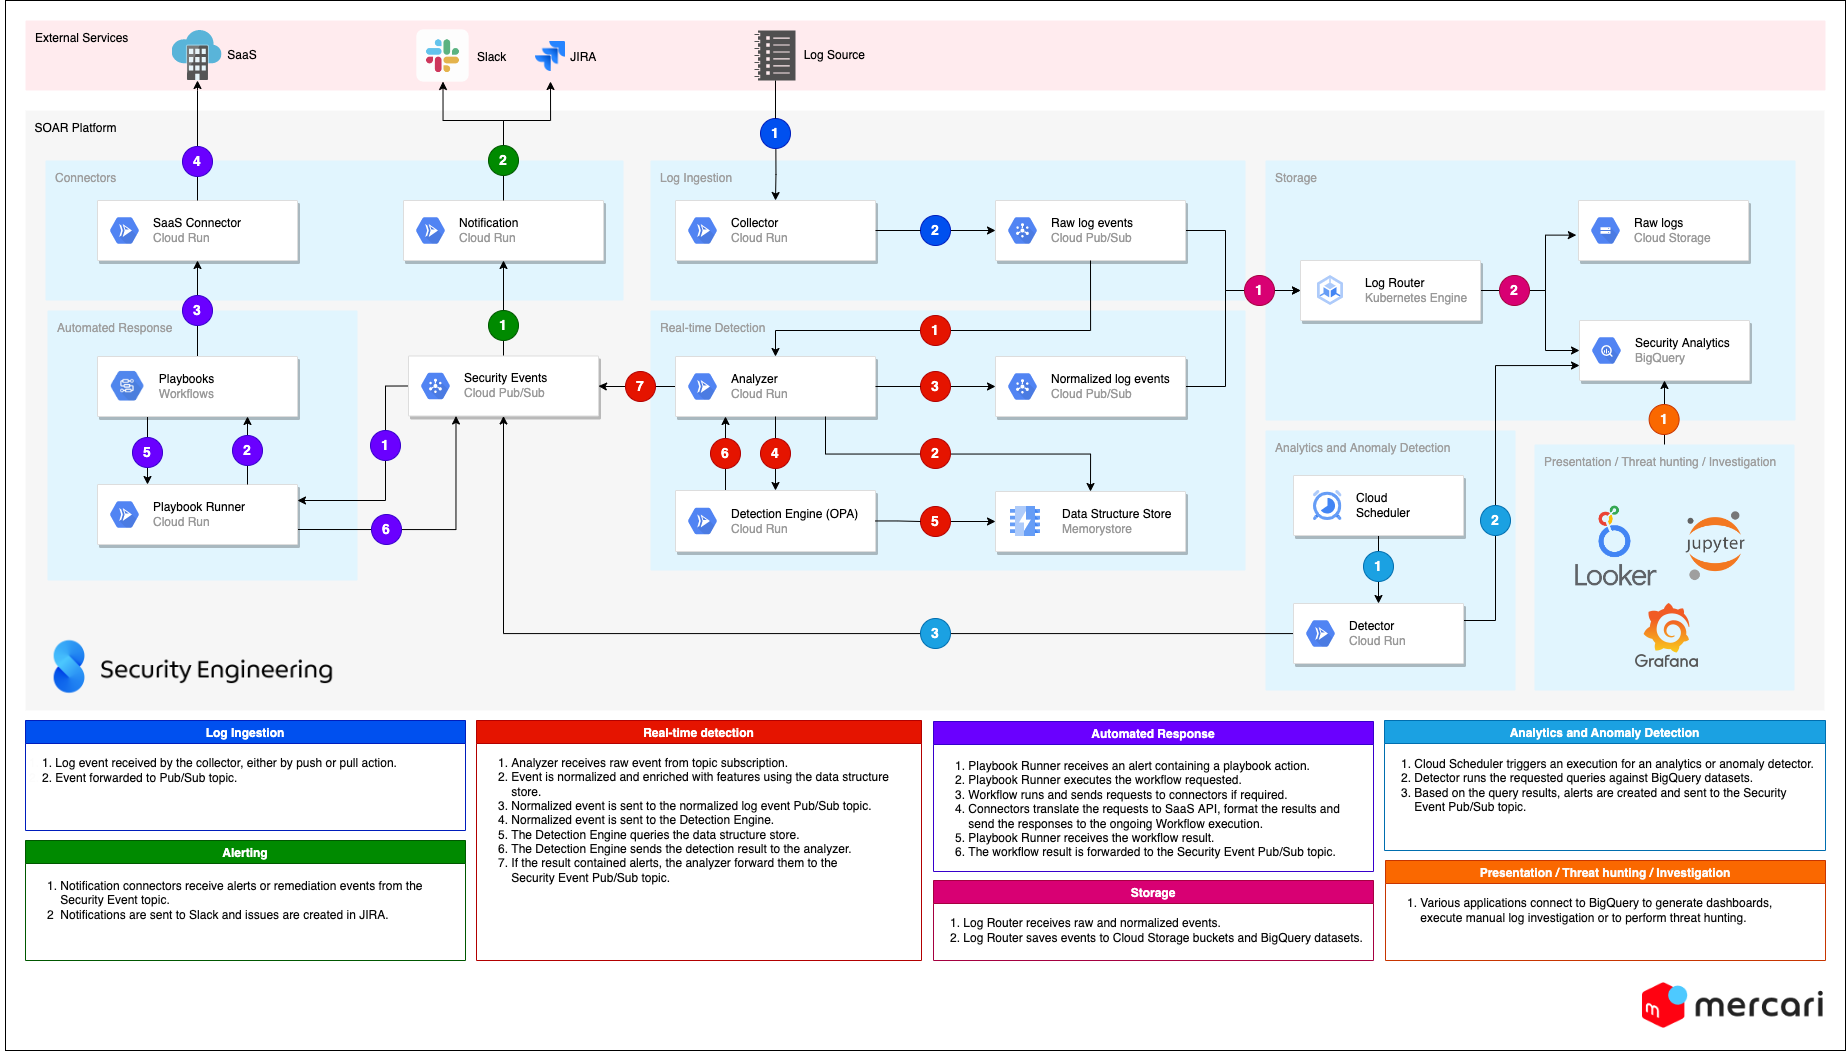
The platform is a set of components that we deploy on Google Cloud, where each component has specific roles, working and interacting with each other using APIs and an event-broker, just like microservices.
The main components are:
- Collectors:
Using a push or pull mechanism, the collectors are serverless agents whose role is to ingest raw log events or vulnerability/threat intelligence data from various sources, in real-time or batched in short intervals when not feasible. They are the first step in our ingestion pipeline and a collector is deployed for each log or feed type. We also have collectors that can aggregate many log sources, like a collector emulating a Splunk HEC, but they can also easily be split if needed. It is easier to keep collectors limited to a specific source, offering better stability in case of a sudden surge of events or for debugging purposes. Collectors forward the events to a Pub/Sub topic. Runs on Cloud Run and Cloud Function. - Analyzers:
For each log type, we have an analyzer, consuming the events published by collectors to the streaming log topic. Their role is to parse the events, normalize them and enrich them. The analyzer contains many modules and each deployment is configured with the integration needed for the log type ingested. Once normalized, the events are sent to two different destinations, firstly streamed down to a topic for normalized events, and secondly to the real-time detection service. Based on the results from the detection service, if threats are detected, alert events will be created and forwarded to the security event topic. Runs on Cloud Run. - Connectors
Connectors interface primarily with external services, to execute actions or gather information. For example a slack connector to send events to a channel or receive commands, a JIRA connector to create incident cases, or simply to glue data together in a remediation workflow. Runs on Cloud Run and Cloud Function. - Real-Time Detection Engine
Detection rules are applied on log streams in real-time. All rules are written in a common programming format called Rego. The detection engine is powered by an Open Policy Agent (OPA) server. I’ll discuss more about OPA later in this article. Runs on Cloud Run. - Log Router
The log router subscribes to both raw and normalized log topics and forwards them to various storage backends, like Google Cloud Storage, BigQuery, and other Pub/Sub topics. We use fluentd/fluentbit containers deployed on Kubernetes (GKE). - Analytics and Anomaly-based Detectors
We supplement real-time detection with other types of detection that can’t be done easily on a log stream, like large analysis of data, looking for outliers, behaviors. The detectors run periodically on top of the security and log events data lake. This is still in the early stages but we have some big ideas for this on our roadmap. Runs on Cloud Run. - Playbook and Workflow Automation
We codify SOC processes and response to detection into playbooks using workflows automation. A service watches for alerts published by the analyzers and if there is an automated playbook associated with the alert, the service will execute it. It’s also possible to call playbooks interactively from Slack or from the command-line too. See below for more details about them. Runs on Cloud Run and Google Cloud Workflows. - Data Structure Store
We have two main uses for the data structure store component, storing states for some of our rules and to cache various data, like lists of IP addresses, threat indicators, user analytics, etc. Runs on Redis. - Data Lake
All data ingested and created by the SOAR platform are written to Google BigQuery datasets. We can store a limitless amount of data which can be used for analytics, investigations, and more detection rules. For example we use Jupyter Notebooks backed with BigQuery to do investigation and threat hunting, we’ll share more information on that in an upcoming blog post by Simon. Recently Google announced that BigQuery can now support semi-structured data in JSON format and also full-text search via indexes, and finally it is possible to run machine learning models on BigQuery. - Presentation
The presentation component is all about displaying information to the security team, we’re still exploring this area but we narrowed it down to a mix of Grafana, Looker and a custom web frontend. For case management we’re currently using JIRA and notifications in Slack.
In terms of code organization, we have divided it into a few git repositories:
- Infrastructure: resources, environments and access are managed in terraform manifests
- A monorepo for all SOAR component code: collector, analyzers, connectors, workflows
- Detection rules: the source of truth for all detection-as-code rules.
- Schemas: we keep multiple schemas for SOAR components, log normalization schema, alert schema, remediation event schema. We manage the schemas in YAML files, which are then used to auto-generate protobuf files, Go packages, Python libraries and BigQuery schemas.
- CI/CD pipelines: We have a dedicated repository for continuous integration and continuous deployment, we keep it separate from the codebases listed above for security reasons. For details on why we do this, see our blog about “CI/CD and CI scripts managed outside monorepos”.
Next I’d like to explain a bit more about writing detection rules and provide some examples.
Threat Detection Rules
Where do we start with detection and how to build good detection rules?
Firstly, without good data there’s not much we can do. It is one thing to collect and ingest data to provide security monitoring, but data quality is crucial to provide good analysis and detection. You have to consider these 3 points:
- Data Completeness
This represents the degree of availability of logs and the breadth and depth of the events recorded. It also represents the duration of log retention.- Logs exist and are available for ingestion
- All actions and parts of the service or system that should be audited are recorded
- Levels of accessibility (local file, database, closed system)
- Data Timeliness
This constitutes the degree to which we expect information to be accessible and available. Timeliness can be measured as the time between when information is expected and when it is readily available for use.- The system can stream events as they occur
- The system can provide all events using a point in time
- All events are time stamped and represent the correct time when events occurred
- Data Consistency
This refers to the absence of inconsistency between events when compared against other events containing the same type of information, from the same source or other sources. It is also about producing the same event data for the same activity.- Standard naming convention for fields across log sources from the same services. Avoid different field names representing the same user data, e.g. username, userId, account_name
- Event data follows a unique structure or schema across all messages
- No duplication of events
- Each events data is recorded as a complete and single message
Secondly, whatever techniques and tactics are used by an adversary, it will always introduce a change in your environment; it could be an entry in your web server logs, a file written, a phishing email received in an inbox, a network socket opened, a new account created, and so on. In an ever changing cloud environment it can be hard to identify what is deemed a threat and what can be considered normal activity.
This is where detection engineers have to blend threat modeling and threat intelligence to build rules. While building them we have to keep in mind that we will always have knowns and unknowns, which is to say that there are actions that we know are bad and some that we don’t know are bad. For both actions types, we can categorize them as a change in your environment or part of a threat, each providing a varying context level from low to high.
Known bad:
- Change in your environment: An event that we understand and is easy to describe as a rule, they are deterministic, and they provide high context.
We can formulate the rule: “If observed change A equals B, then alert W” - Threat indicator: An event related to an indicator that we know to be bad, for example an IP address connected to a threat actor, a hash value for a known malware. It provides low to no context by itself.
We can formulate the rule: “If indicator A is observed, then alert X”
Unknown bad:
- Anomaly in your environment: Categorizing by defining “normal” events and measuring deviation from the definition, using a small number of properties and aggregating them. It provides low context.
We can formulate the rule: “If observed change A equals B and C > average of peers, then alert Y” - Threat behavior: Similar to the above but here we work with a lot more features and data points across a period of time (minutes, days, weeks) and space (variety of entities like devices and users). It is possible that it is only visible to an algorithm and not a human. It provides high context.
We can formulate the rule: “If entities(A,B) AND system C over time D, then alert Z”. At this level it can be hard to formulate good rules, it requires a lot of creativity and often a mathematical model could build rules automatically for us.
Low to no context events by themselves will create many false positives, but they are very good for enriching high context events, and providing context to adjust the severity score of an alert.
Let’s use a scenario to understand how it all fits together:
An attacker compromises an employee’s personal computer and steals their private ssh key and ssh known_hosts file. The attacker then connects to all hosts listed in the known host using the ssh key, installs and starts a crypto-miner on all of them.
- Change in your environment: successful ssh login, network connection recorded in your firewall, file written to disk.
- Threat indicator: Source IP for the ssh session is linked to a known Monero crypto-miner campaign and the file’s hash is known to be a crypto-miner.
- Anomaly in your environment: We rarely observe employees connecting to servers by SSH outside of work hours, there’s a sudden CPU usage increase on servers.
- Threat behavior: If a user ssh into many servers in a short period of time, write a file, execute a file, then immediately logout and all servers start sending egress traffic to a unique destination, send an alert.
Again, using the same scenario, I’ll demonstrate how we would code these threat detections as rules in rego, a declarative logic programming language based on datalog and built for Open Policy Agent (OPA). OPA is an open source, general-purpose policy engine hosted by the CNCF. It is commonly used on Kubernetes with Gatekeeper as a way to enforce policies on the cluster. How to write rego rules is outside the scope of this blog post, but without any knowledge of rego you’ll surely be able to understand how readable and simple it can be. It is important to mention that we have developed custom functions to extend OPA on data streams using the data structure store component, I’ll highlight them to avoid confusion.
scenario_rules.rego
package scenario

alert[msg] {
    title := "High ssh login rate for a user"

    duration := "5m" # 5 minutes
    threshold := 10 # 10 logins
    endswith(input.logName, "logs/syslog")
    contains(input.jsonPayload.message, "pam_unix(sshd:session): session opened")

    user := regex.find_all_string_submatch_n("for user ([^ ]+)", input.jsonPayload.message, 1)[0][1]
    hostID := input.resource.labels.instance_id

    # rateLimit() is a custom function
    sshLoginCount := rateLimit(sprintf("%s-sshLoginCount", [user]), duration)
    sshLoginCount > threshold

    msg := {
        "title": title,
        "details": sprintf("%s connected by SSH multiple times (%d) in a short period of time (%s)", [user, sshLoginCount, duration]),
        "riskScore": 10,
        "entities": [user, hostID],
    }
}

alert[msg] {
    title := "SSH Login from known threat actor"

    hostID := input.resource.labels.instance_id
    endswith(input.logName, "logs/syslog")
    remoteIP := regex.find_all_string_submatch_n("sshd.*Accepted publickey for [^ ]+ from ([^ ]+)", input.jsonPayload.message, 1)[0][1]

    isThreatActor(remoteIP) # Returns true if found, custom function

    msg := {
        "title": title,
        "details": sprintf("Successful ssh login to %s from threat actor at IP address %s", [hostID, remoteIP]),
        "riskScore": 20,
        "entities": [hostID],
    }
}

alert[msg] {
    title := "Cryptojacking warning"

    cryptominerSHA := {
        "c47606c32ad87da2dfc480e6c855da4196ceefb60a27fc69a9da9233d38d697a",
        "066f103e7433559e3a128dcee6d78fa49c90edbb63f60d3b0925c0bbfa3a0f13",
        "ec9e6b7d3f0df38daf439fa8181c0dcca03a8036104517641c480ba500bcedf4",
    }

    cryptominerPath := input.osquery.file_event.target_path
    hostID := input.osquery.host_identifier

    input.osquery.file_event.sha256 == cryptominerSHA[_]

    msg := {
        "title": title,
        "details": sprintf("'%s' was detected to be a cryptominer on host %s", [cryptominerPath, hostID]),
        "riskScore": 30,
        "entities": [hostID],
    }
}
As explained earlier in the article, we adopt a test-driven development to verify the correctness of our rules, OPA provides a test framework, making it easy to write tests. Let’s write a test for one of our rule:
scenario_rules_test.rego
package scenario

test_file_is_a_cryptominer {
    input := cryptominerEvent
    msg := alert with input as input
    count(msg) == 1 # We should get one alert message
}

test_file_is_not_a_cryptominer {
    input := normalEvent
    msg := alert with input as normalEvent
    count(msg) == 0 # We shouldn't get an alert message
}

cryptominerEvent = {"osquery": {
    "host_identifier": "hostA",
    "file_event": {
        "target_path": "/tmp/monero",
        "sha256": "066f103e7433559e3a128dcee6d78fa49c90edbb63f60d3b0925c0bbfa3a0f13",
    },
}}

normalEvent = {"osquery": {
    "host_identifier": "hostA",
    "file_event": {
        "target_path": "/tmp/safefile",
        "sha256": "dafeddc7dec7f4642a7c6ba93329ca88ac4759a61c1a4f9b6ac087eb9ae45899",
    },
}}
We can verify that the rule tests pass and the tests coverage with the opa command line:
$ opa test -v scenario_rules.rego scenario_rules_test.rego
data.scenario.test_file_is_a_cryptominer: PASS (483.332µs)
data.scenario.test_file_is_not_a_cryptominer: PASS (253.579µs)
--------------------------------------------------------------------------------
PASS: 2/2
$ opa test -c scenario_rules.rego scenario_rules_test.rego | jq .coverage
52.95
Using a git workflow, we can then commit our changes to the rules git repository and submit a pull request. The CI pipeline will run our tests, if they pass they will automatically be deployed to our testing environment, useful if we want to inspect the result with streamed data. Once the rules are approved, the engineer can merge their changes to the main branch and the CD pipeline will deploy the rules to the production OPA server.
For the threat behavior rule, it would be deployed as an Analytics and Anomaly-based Detector, in its most basic form it would be a SQL query scheduled to run periodically on BigQuery.
Automated Response
Detection is only half of the battle, once we have detected something we have to take action on it. This can take many forms, like investigating other related activities, contacting a user, or blocking network traffic. We are far from being able to fully automate remediation and response for all types of detection but detection engineers can use the SOAR system to create playbooks to improve security and operational efficiency.
Continuing with our scenario, let’s define one possible way on how we could link a remediation process to a detection in our SOAR platform. First we’ll add a new playbook field to one of our previous rules, under msg:
scenario_rules.rego
alert[msg] {
    title := "High ssh login rate for a user"

    duration := "5m" # 5 minutes
    threshold := 10 # 10 logins

    endswith(input.logName, "logs/syslog")
    contains(input.jsonPayload.message, "pam_unix(sshd:session): session opened")
    user := regex.find_all_string_submatch_n("for user ([^ ]+)", input.jsonPayload.message, 1)[0][1]
    hostID := input.resource.labels.instance_id

    # rateLimit() is a custom function
    sshLoginCount := rateLimit(sprintf("%s-sshLoginCount", [user]), duration)
    sshLoginCount > threshold

    msg := {
        "title": title,
        "details": sprintf("%s connected by SSH multiple times (%d) in a short period of time (%s)", [user, sshLoginCount, duration]),
        "riskScore": 10,
        "entities": [user, hostID],
        "playbook": {
            "name": "scenario-demo",
            "args": {"userID": user, "hostID": hostID},
        },
    }
}
We use Google Workflow to codify our playbooks, enhanced with our connectors, I’ll provide a working example of a playbook using the following fictive response:
“When a user logs in to multiple servers in a short period of time, verify the current risk score for the server and for the user, if they are above the recommend risk score threshold, remove the user’s ssh key from authorized_keys on each host, terminate any ssh sessions ongoing and notify the user about the action taken”.
scenario_demo.yaml
main:
    params: [input]
    steps:
    - init:
        assign:
        - project_id: ${sys.get_env("GOOGLE_CLOUD_PROJECT_ID")}
        - secret_id: "slack-token"
        - version: "1"
    - expression:
        assign:
        - slack_token: ${googleapis.secretmanager.v1.projects.secrets.versions.accessString(secret_id, version, project_id)}

    - getUserRiskScore:
        call: http.post
        args:
          url: https://risk-score-abcd12345-an.a.run.app/user
          auth:
            type: OIDC
          body:
            parameter: ${input.userID}
        result: userRiskScore

    - getHostRiskScore:
        call: http.post
        args:
          url: https://risk-score-abcd12345-an.a.run.app/host
          auth:
            type: OIDC
          body:
            parameter: ${input.hostID}
        result: hostRiskScore

    - checkRiskScoreThreshold:
        switch:
          - condition: ${hostRiskScore.body.value > 30 AND userRiskScore.body.value > 20 }
            next: disableUserSshPublicKey
        next: endPlaybookExecution

    - endPlaybookExecution:
        return: Risk score low - Exiting.

    - disableUserSshPublicKey:
        call: http.post
        args:
          url: https://oslogin-connector-abcd12345-an.a.run.app/user/disable
          auth:
            type: OIDC
          body:
            parameter: ${input.userID}
        result: disableUserResult

    - validateDisableUserResult:
        switch:
          - condition: ${disableUserResult.body.outcome == "success" }
            next: slackNotify

    - slackNotify:
        call: http.post
        args:
          url: https://slack.com/api/chat.postMessage
          headers:
            Content-Type: "application/json"
            Authorization: ${"Bearer " + slack_token }
          body:
            channel: C046N1DTZGB
            attachments:
            - blocks:
              - type: section
                text:
                  type: mrkdwn
                  text: ${"We have detected suspicious SSH activity from your account " + input.userID }
              - type: section
                fields:
                - type: mrkdwn
                  text: SSH login access to servers was disabled. Contact the security team for details.
For the sake of simplicity I’ll deploy the workflow directly from my local machine using the gcloud CLI:
$ gcloud workflows deploy scenario-demo \
    --source=scenario_demo.yaml \
    --service-account=workflows-sa@security-project.iam.gserviceaccount.com
WARNING: The default location(us-central1) was used since the location flag was not specified.
Waiting for operation [operation-1652438877333-5dee2684be826-a327dc7a-e07d750b] to complete...done.
createTime: '2022-05-13T09:24:13.204483835Z'
name: projects/security-project/locations/us-central1/workflows/scenario-demo
revisionCreateTime: '2022-05-13T10:47:57.443412797Z'
revisionId: 000009-0dc
[...]
state: ACTIVE
updateTime: '2022-05-13T10:47:58.402442707Z'
The playbook is available now and it will be run on the next alert for that specific rule. The alert is published to the security-event topic and our playbook service will look for the “playbook” field and make an execution call to the named workflow using the arguments provided.
Next I’ll provide fictive numbers to test the playbook: user Bob suddenly uses ssh to connect to 5 servers at midnight, downloads a crypto-miner to each server and disconnects. For each server a number of alerts were triggered (e.g. crypto-mining tool hash found on server), raising their risk score to 60, at the same time the abnormal activity by Bob raised his risk score to 50.
Again for simplicity I’ll input the scores in the data structure store and run the workflow from my local machine with the required arguments:
$ gcloud workflows run scenario-demo --data='{"userID":"bob@corp","hostID":"d1277634511"}'
WARNING: The default location(us-central1) was used since the location flag was not specified.
Waiting for execution [d106b6c0-1105-4495-82ca-d7083f00fd12] to complete...done.
argument: '{"hostID":"d1277634511","userID":"bob@corp"}'
endTime: '2022-05-13T10:52:37.575712559Z'
name: projects/1234567890/locations/us-central1/workflows/scenario-demo/executions/d106b6c0-1105-4495-82ca-d7083f00fd12
result: 'null'
startTime: '2022-05-13T10:52:36.023992096Z'
state: SUCCEEDED
workflowRevisionId: 000009-0dc

It is worth mentioning that Workflows include audit logs out of the box, so we can always know who, when, and why a playbook was executed.
In conclusion
Threat detection is a fundamental part of the security program at Mercari, our approach with detection-as-code and SOAR helps building and deploying detection rules quicker, thus reducing even more our mean time to detect and mean time to respond to incidents.
In a following article I’ll dive deeper on how we can verify that we have sufficient detection coverage and how to measure detection quality using frameworks and methodologies.
If you are interested in knowing more about our team, check our article about the Threat Detection Engineering team. The Security Team is looking for talented security engineers to join our team! If you are interested in working with us and improving our SOAR platform, please see our career page here.
References
[1] Blogs and talks:
https://engineering.mercari.com/en/blog/entry/20220121-securing-terraform-monorepo-ci/
https://engineering.mercari.com/en/blog/entry/20220203-defense-against-novel-threats-redesigning-ci-at-mercari/
https://speakerdeck.com/rung/cd-pipeline
https://speakerdeck.com/tcnksm/how-we-harden-platform-security-at-mercari