*This article is a translation of the Japanese article published on February 8th, 2022.
Note: This article is part of our "Blog Series: Introduction to Developer Productivity Engineering at Mercari."
Introduction
Hello. This is Yoshinobu Fujimoto (@jimo1001) from the Mercari Microservices SRE Team.
I’m an Embedded SRE in the Search Infrastructure Team, which provides microservices related to searching at Mercari JP. I’m currently working on improving service reliability and automating infrastructure-related tasks. In this article, I’ll be covering benchmarking automation, which is used to maintain product search response performance at Mercari.
Search platform architecture
I’ll begin with a simple overview of our search platform architecture. The simplified diagram below shows only the major components.
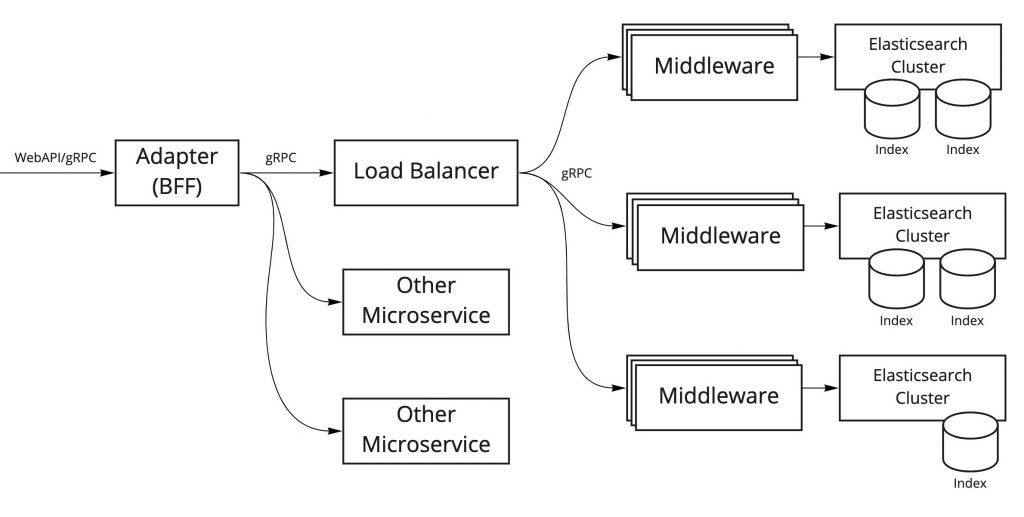
The roles of each of these components are described below.
Elasticsearch Cluster
At Mercari, we use Elasticsearch to implement our search feature. To provide the best search experience to our users, we create Elasticsearch clusters and indexes which are optimized based on search content and search conditions.
(Search) Middleware
The Middleware provides gRPC endpoints for connection with Elasticsearch and are connected to each Elasticsearch cluster. In addition to returning Elasticsearch results, these components perform a wide variety of generic processes related to searching (such as re-ranking), so I refer to them as "search middleware."
Load Balancer
This component performs load balancing on requests sent to search middleware, and it performs middleware routing associated with each Elasticsearch cluster. We also use this to control traffic when Elasticsearch clusters are rebuilt, or when a canary releases are made.
Adapter (BFF)
This system is responsible for backend for frontend (BFF), and processes multiple Elasticsearch results along with request results from other microservices.
For our current benchmarking automation project, we’re focusing on the search middleware and Elasticsearch clusters. These components are closely linked together and are directly linked with search response performance, so we need to evaluate performance carefully.
Benchmarking Automation
The goal of benchmarking automation is to detect performance degradation before it happens, or immediately afterwards. The main factors for performance degradation that we watch for are as follows:
- Reconfiguring Elasticsearch (such as changing the index schema or upgrading Elasticsearch to the latest version)
- Changing/adding search middleware functionality
- Changes to product search trends among users
This work also involves automating load tests which are conducted each time a release is made. Therefore another goal for us is to reduce the time and resources spent on these load tests.
In order to accomplish this, we need to continuously…
- Run automated benchmarking regularly
- Run automated benchmarking triggered by CI/CD execution of software development
… and also pay attention to any changes in benchmark results.
Benchmark results are compared with other results to determine whether performance has improved or worsened, it is therefore important that we execute the benchmarks in a consistent environment:
- Using the same machine resources (such as CPU and memory) for benchmark client nodes and benchmark target nodes
- Using the same benchmark conditions (such as requests per second, number of parallel executions, and execution time)
When running a benchmark, having too many machine resources free can actually be a detriment, as this can easily hide performance degradation. It’s important to adjust machine resources and benchmark conditions so that anywhere from 80% to 100% of resources are being utilized when the load is at its peak when benchmarking.
Platform for running benchmarking automation
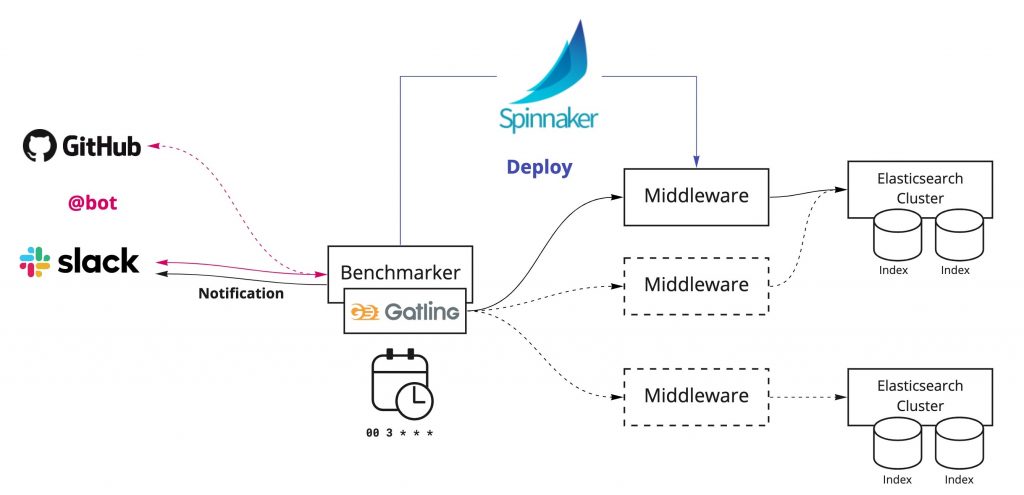
The diagram above shows the platform we’ve built to run benchmarking automation.
The core of this platform is the Benchmarker, a component that runs benchmarking, provides results notification, and connects with external services. This component exists in a VM instance on GCP, and we adjust kernel parameters and ulimit resource limits to ensure that benchmarking can run reliably.
Benchmark execution triggers
In order to discover problems quickly and determine why they are occurring, and get to the bottom of what is going on. It’s important, then, to provide means that can be run benchmarks in many situations. We currently have two methods of running benchmarks, but it’s still not enough. We plan to add more.
Run benchmarks periodically using CronJob
We use CronJob to run periodic benchmarks. This is run at specific times on each day, and results are provided to Slack.
Run benchmarks using a Slack bot
We can also run a benchmark at any time from Slack.
Automatic deployment using Spinnaker
In order to run benchmark testing on any given version of the search middleware, we use Spinnaker to deploy a specified version ahead of time, and then run testing when the service is started.
Benchmark testing using Gatling
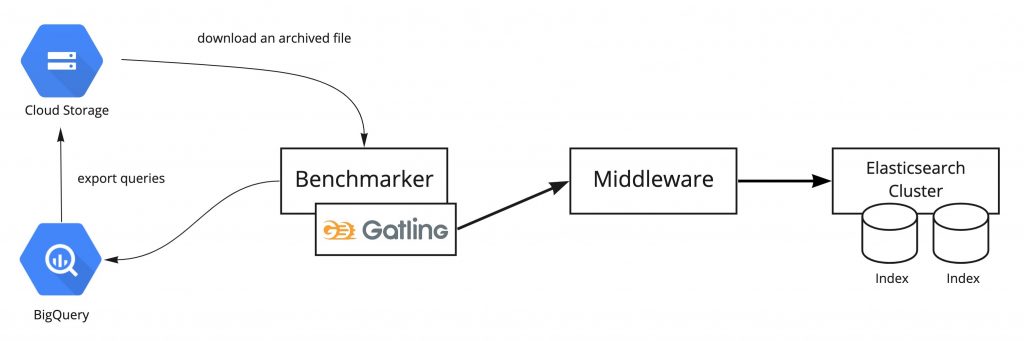
We use a load testing tool called Gatling to request search queries in parallel to the search middleware, and to measure response times and status. Gatling is capable of generating extremely rich HTML reports. These are saved in cloud storage, so that we can check them along with result summaries from Slack benchmark result notifications.
The search queries that are used for testing are downloaded from query logs saved in BigQuery, which have been extracted and exported to cloud storage during the benchmark.
Future plans
This is all currently under development and there’s still a lot more to accomplish. We hope to connect with various services, enhance test result visualization, and make the platform easier to use.
Calculate benchmark scores
We currently provide notification of Gatling raw test results, which makes it difficult to determine at a glance if performance has increased or decreased. If we could calculate and present benchmark scores that accurately reflect test results, it would make it easier for people to understand what they are seeing, and would also make it easier to monitor by machines.
Connect to Datadog
The metrics generated from the benchmarking platform are registered to Datadog. If we could show benchmark testing trends and results on the same dashboard along with metrics such as CPU utilization, error rate, and latency, we could conduct closer analysis, and could also make it easier to identify why a particular problem is occurring.
Connect to GitHub
If we could run benchmark testing and check results from GitHub pull requests, then we could instantly check for performance dips during development, which would make it even easier to develop services.
Conclusion
In this article, we covered some of our work with benchmarking automation involving benchmark testing conducted regularly and automatically, with the goal of being able to quickly detect drops in response performance.
We are currently working to implement a lot of features, and we still have a lot of work to do with regard to measuring effectiveness. I plan on posting again once we’ve made some more progress.