Preface
This blog is part of the Security Tech Blog Series, written by Anna from the Mercari Security Engineering Team.
In this blog I will explain how we implemented cloud monitoring to our SOAR (Security Orchestration Automation and Response) system using Google Cloud services and Terraform. I hope that some of the tips I share here will be of interest to you if you are considering implementing cloud monitoring using these tools, but don’t know where to start.
The base of the featured image above is generated by OpenAI’s DALL·E.
Introduction
In one of our previous articles, David (the lead on our SOAR system development) explained in detail how we built our monitoring platform. As you can see from the system diagram in the article we use many GCP components in our platform. Given that we are not perfect developers (at least I am most certainly not), and the log sources can err, or even the GCP services themselves can have issues, after a few cases of "I wonder why I can’t see the recent logs in BigQuery" and "why didn’t we have any alerts at the weekend?", we decided it was high time to begin monitoring our monitoring to prevent these kinds of issues occuring.

While our engineers use Datadog for cloud monitoring, we decided to go with GCP’s own built-in solutions, to keep things simple.
Error Reporting
The first goal was to integrate Error Reporting into our infrastructure. Error Reporting is a fairly new and overlooked part of GCP, with Slack integration implemented only in March 2022. Error Reporting groups the errors it receives based on the error messages, lets you handle them by setting the state to open / acknowledged / resolved, and most importantly: sends notifications to specified notification channels if a new error occurs, or a resolved error reoccurs. With the use of Error Reporting we were able to cover a large portion of our infrastructure, and gain insight to see if anything goes wrong within our collectors and analyzers.
From the SOAR article mentioned above you can see we use Cloud Runs and Cloud Functions written in Go for the collectors and analyzers. Previously our error handling was implemented as shown below:
if err != nil {
    fmt.Printf("error parsing json: %s", err)
    return
}
A simple fmt.Printf() will appear in the logs as "Default level", which looks like the following in Cloud Log:
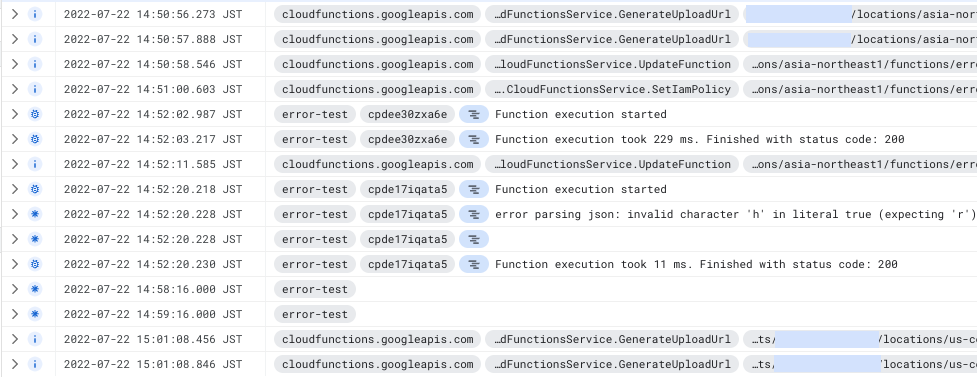
If we noticed that something was off with one of our components, we checked the logs and looked for traces of errors. Given that most of our components produce a ton of logs, it was sometimes difficult to find the correct line. Adding to this, previously we had the default filter in the _Default Log Router Sink, meaning that we logged all severity level messages, but we modified it to only log warning severity or above logs to save on logging costs. This way we weren’t seeing these “error” logs at all, and needed another solution.
In order to make these log messages show up as error level messages, and to send them to Error Reporting, you need to format your logs in the correct way, as explained in the GCP documentation. To achieve this you can implement your own library or choose from the existing solutions.
Instead of using the Go package cloud.google.com/go/errorreporting which is only tailored for sending errors to Error Reporting, we decided to use a slightly modified version of Zapdriver, since it handles all logging levels, and additional data can be added easily via labels and fields. We uploaded our fork of the Zapdriver to the Mercari Github, feel free to check it out!
Basically, we wrote a wrapper around a zaplogger that sends all the errors to Error Reporting and sets the service name of the component automatically with the help of the K_SERVICE variable, which exists both in Cloud Run and Cloud Function by default. So to initialize a new logger, we just need to call our constructor:
logger, err := zapdriver.NewLoggerWithKServiceName()
if err != nil {
    fmt.Printf("Initializing new logger: %v", err)
    os.Exit(1)
    }
}
And by implementing some wrapping functions for error logging now we handle the errors like this:
if err != nil {
    logger.Error("Error message", err)
    variable := "message"
    logger.Errorf(err, "Error with format string %s", variable)
    return
}
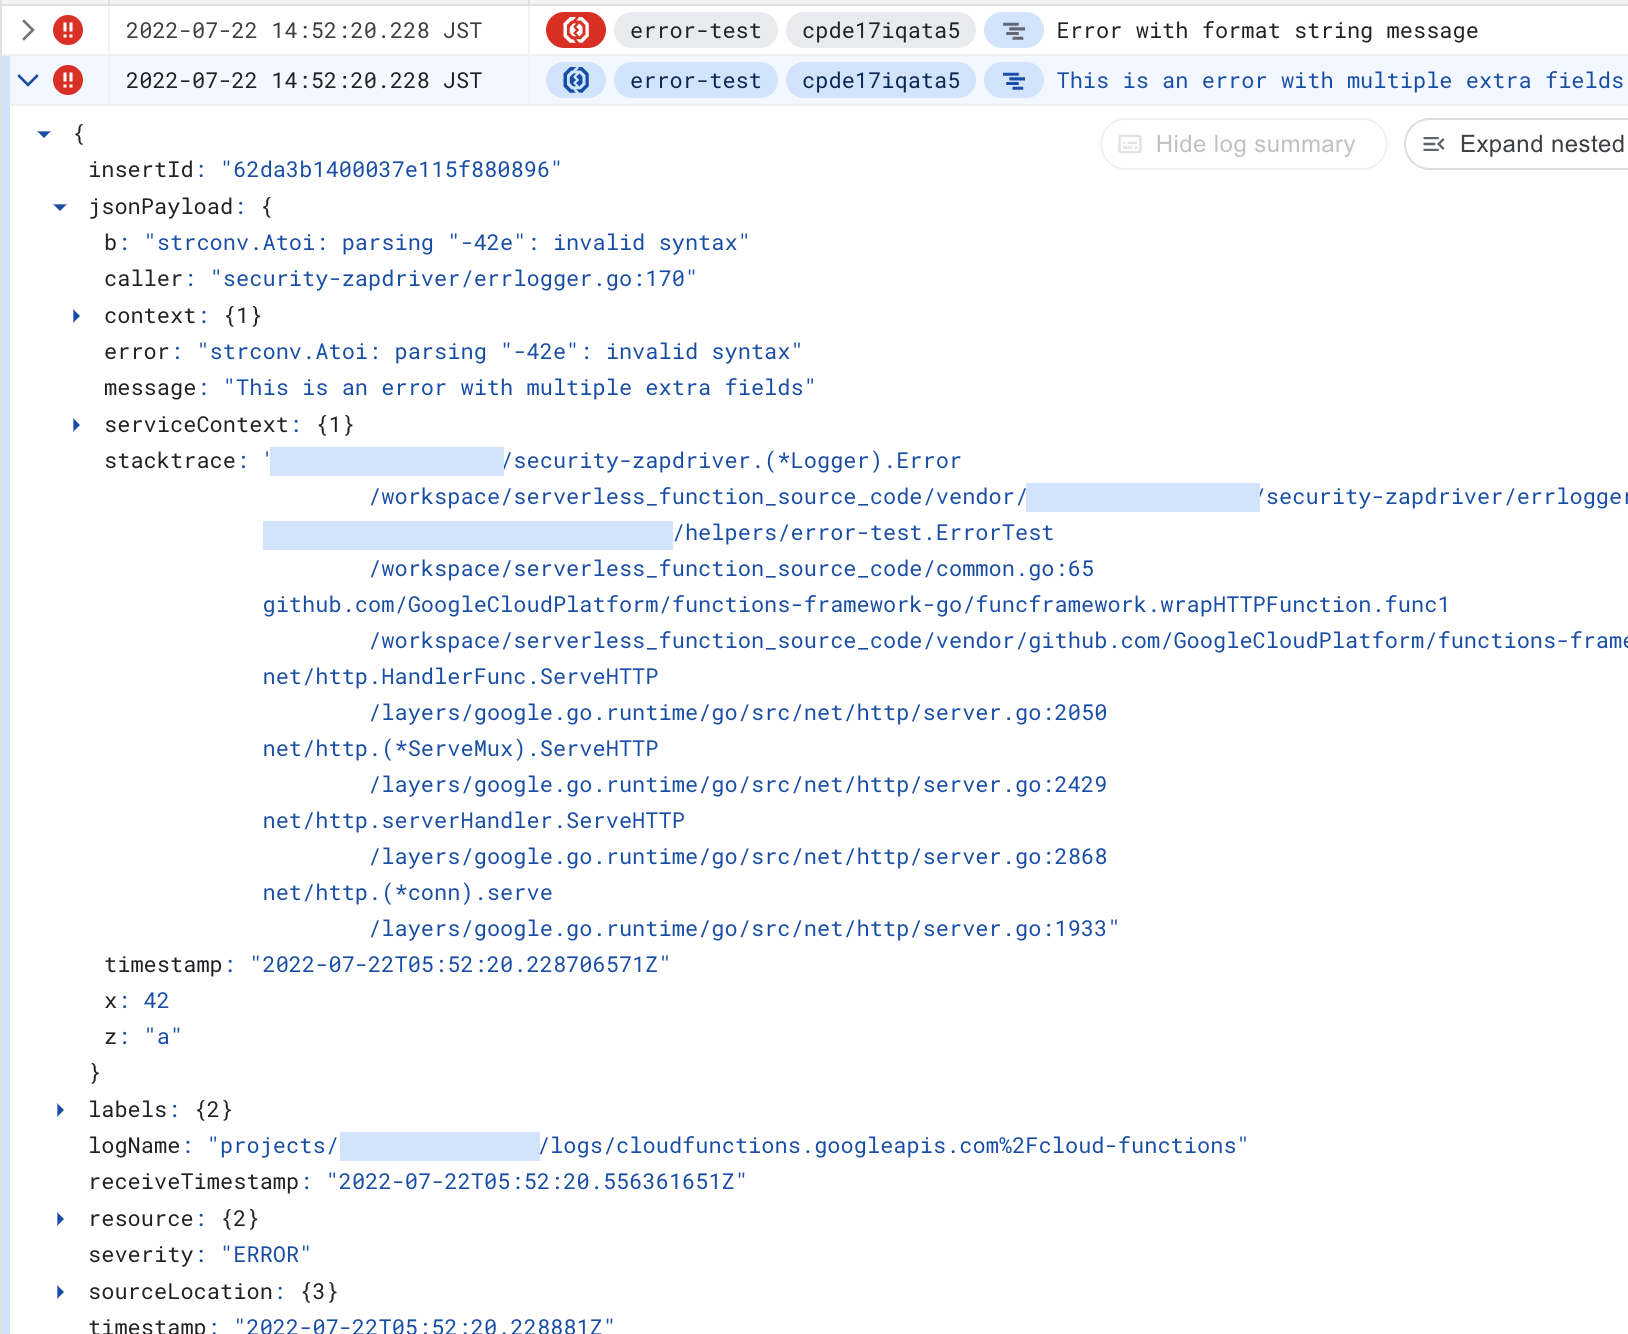
We can also set Labels and Fields, making use of the structured nature of logs in Cloud Log:
    logger.WithFields(map[string]zapdriver.Field{
        "x": 42,
        "z": "a",
        "b": err,
    }).Error("This is an error with multiple extra fields", err)
And the result looks like this in Cloud Log:
The neatest part is that now we get the error logs in Error Reporting too:

And by setting a notification channel we can even get them directly delivered to our dedicated Slack channel as well, removing the need to manually check the Error Reporting page:

If we fix an error, we set it to Resolved, and if the error reoccurs for some reason, we get notified again.

However, after setting up this system we found that sometimes we weren’t getting notifications for some specific errors. We couldn’t figure out the reason, but with the help of GCP Support we learned that the issue was that we modified the _Default Log Router Sink as mentioned above, to only log warning severity or above logs. It turns out, Error Reporting looks for a lower severity log message as a trigger to add new errors to Error Reporting. So the following log message has to arrive in the _Default Log Router Sink next to the actual error log message in order to have a new error in Error Reporting:

The confusing part is that the triggering log message is different for reoccurring errors, so we received notifications for reoccurring errors. So if you plan to save costs by cutting back Cloud Logging, make sure to include logName="projects/PROJECTID/logs/clouderrorreporting.googleapis.com%2Finsights" logs.
Monitoring
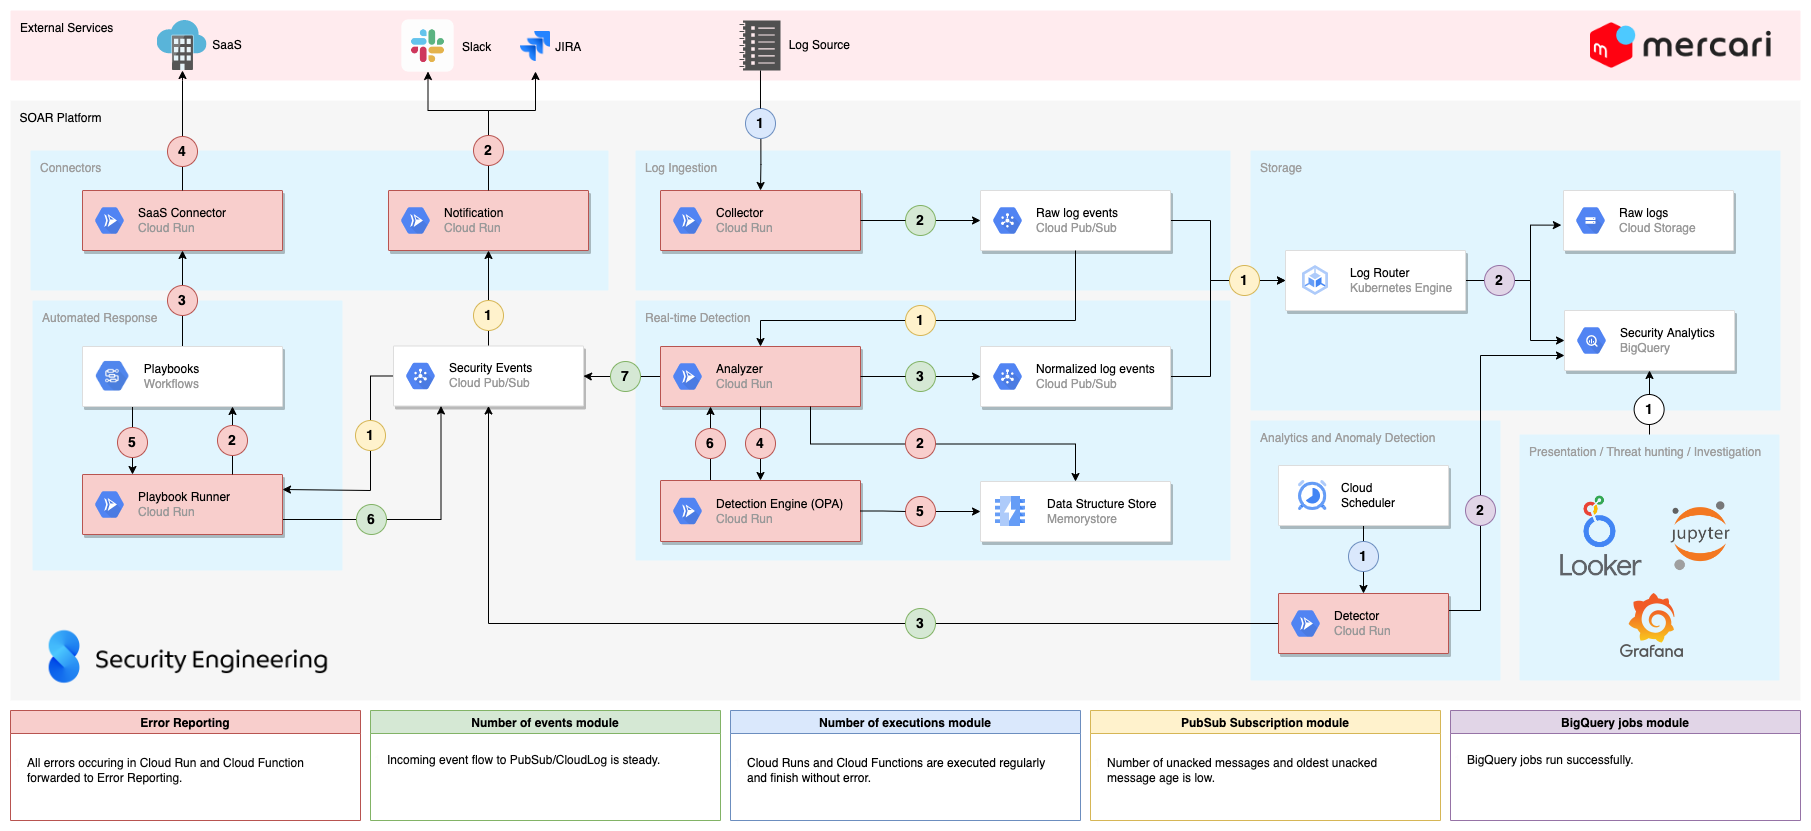
We covered what’s happening within our services, but things can still go wrong in other places as mentioned in the introduction. For these, we defined metrics that we want to monitor. We created Terraform modules for each of the steps in the flow we wanted to observe.
For each module we defined at least one Monitoring Alert Policy and a widget to add to the Monitoring Dashboard.
The Alert Policies can also be configured to send notifications to Slack channels by setting up a Notification Channel. At the time of writing, the Notification Channel resource cannot be set up due to a bug, but we can still use a data source in Terraform.
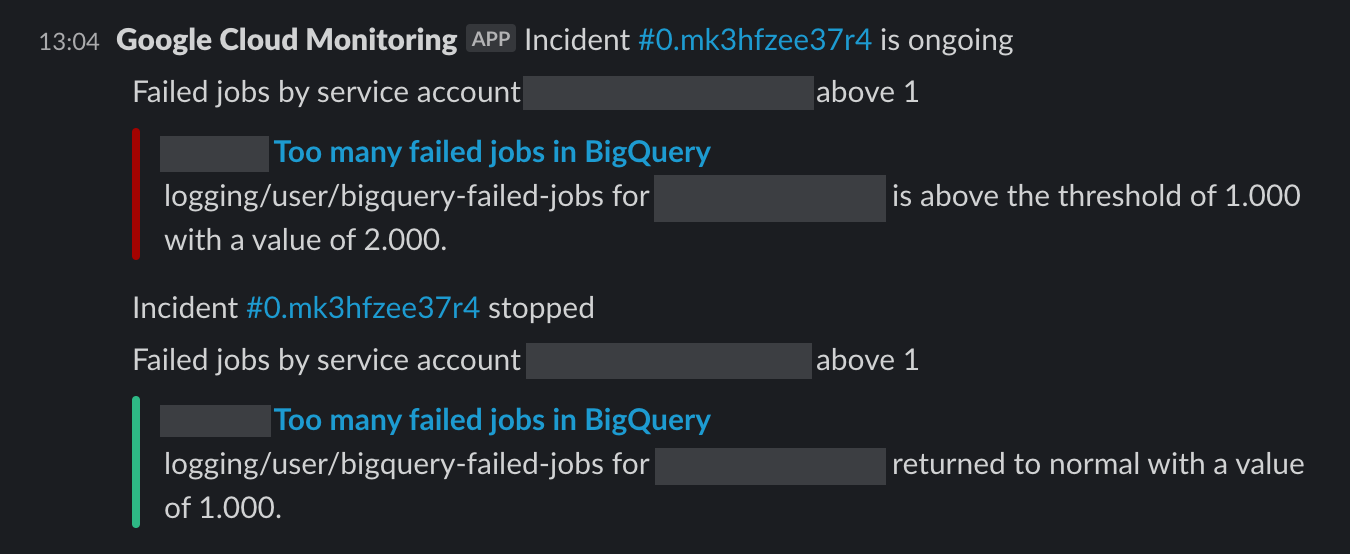
The alerts show up like this in Slack, we also get notified if things get back to normal:
A widget is not a separate Terraform resource itself, it is simply part of a larger JSON object, which is the representation of a Monitoring Dashboard. So we defined the widgets as outputs of the modules and created dashboards by joining them.
All these modules are set up for each service separately, to be able to finetune them. See examples for fine-tuning below in detail. Monitoring modules are now part of our Terraform file templates as well, so it is added to new services semi-automatically.
These monitoring modules are:
-
The number of events a collector forwards. The corresponding policy alerts if there are no events arriving to the resource for one hour. An alert means that there is an issue with the collector (then we should also receive errors from Error Reporting), or with the log source.
Since not all of our collectors pushed logs to PubSub, some pushed to Cloud Log, we have a variable that sets the type of this resource to monitor. We chose to group the modules by logic, not by service type, so it’s easier to swap out when we change the legacy types to the newer one. The filter of the alert policy and the widget is set according to the type variable.
We can also set the period of checking (one hour by default) to a longer one, if the stream of events is more scarce, or even turn off the policy, if we don’t expect incoming events regularly.
We also have a type for checking BigQuery row insertion per table, but unfortunately at the time of writing that metric is delayed by six hours, so we can’t use it for instant detection. -
The number of executions of a collector or an analyzer. We check the number of executions that ended with a normal status (2xx status code for Cloud Run and "ok" status for Cloud Function). If they’re not executed as expected, that means we have an issue with the part that triggers the execution, or with the executions themselves.
We also check the ratio of "not ok" executions to all executions, if it is above a certain threshold, we alert. The alert shows us which service has the issue, and the Error Reporting should help us figure out what caused the issue. We are checking the ratio and not the exact numbers, because we don’t want to get notified of small hiccups, like the log provider being unavailable for a second, but want to know if something goes significantly wrong. (The default threshold for our module is 1%.)
Similarly to the previous module, we have different service types, in this case Cloud Functions and Cloud Runs, but we gather data based on logic, not by service type, so we set the type via a variable within the same module. We can set the number of executions expected, since the magnitude of executions per hour is wildly different for different services. -
The oldest unacknowledged PubSub message / number of unacknowledged PubSub messages per PubSub subscription are great indicators of whether our analyzers and the log router are ingesting properly and have enough resources to work in a timely manner.
-
Finally, we have a policy checking BigQuery insertion jobs, to keep an eye on the last part of the event flow.
Since the number of finished jobs is not a metric in Monitoring by default, we had to define a log-based metric (referred to as a logging metric in Terraform) for failed logs using the following filter:resource.type=bigquery_resource severity>=ERROR protoPayload.methodName=jobservice.jobcompletedAs this by itself doesn’t provide anything else other than the number of logs matching this query, we also defined a label with the email of the actor, to be able to filter based on service accounts running the jobs.
Since our BigQuery tables are in a different project, we needed to set it up as a scoping project (referred to as a monitored project in Terraform).
To be able to see a log-based metric for tables in the monitored project and for tables in our main monitoring project as well, we have to add the same metric to both of the projects. GCP automatically merges those two metrics and shows the data from both projects if checking on Metrics Explorer.
Since we are generating policies for all the services separately, we have a quite impressive list of policies (currently exactly 130), the image below gives you an idea of how it looks like in the GCP console:

But because of the Slack notifications, we don’t have to check the console manually, and having separate policies for all the services gives us the right amount of control.
The big picture
Combining the two methods described above, we’re covering almost the entire workflow, as shown in the diagram below (open in new tab to see full size):
Conclusion
It took us a few weeks until we finetuned the policies not to generate false positives, and to add the error logger package to all of our components, but now if we get a notification in our infra monitoring Slack channel, it means that something actually went wrong. It has proven to be useful in the past few months, and Error Reporting helped us to discover some issues we didn’t know about. For example, you should close your GCP clients even in Cloud Function, because it can cause out of memory errors.
So who watches the watchmen? In our case a few GCP services with the help of Terraform.
Did you find this article interesting, and are interested in helping us build out our in-house SOAR system at Mercari? Then why not apply for a position on our Security Engineering team?


