Hello! This is shmizumo, an SRE at Mercari.
In this article, I will introduce several improvements being made by the Microservices SRE Team, embedded with other teams.
You can read more about the Microservices SRE Team here: Embedded SRE at Mercari.
Working embedded
I joined Mercari in May 2021. I first started working with the Item Team (July through December 2021), and now work with the Mercari API Team (since January 2022). I also do on-call work wherever I’m embedded.
Just as a reference, here I explain what the Item and Mercari API services are.
Item
These are microservice used to manage the various items listed on Mercari. It’s written in Go, and receives as many as 80,000 rps during busy periods. Although most of this access consists of simple Get requests, many other services depend on this crucial service.
The Item Team is responsible for a microservice called Photo, which is used to upload product photos to s3.
Mercari API
This monolithic API service is written in PHP and has been around since before Mercari began promoting the switch to microservices. Although many features have already been migrated to microservices, there are still some important features that have not been migrated, so this service is still being developed by multiple teams.
My embedded duties
In this section, I discuss some of what I do as an embedded SRE.
1. Visualization of Item service SLI/SLO
At Mercari, we set SLOs for each microservice. However, the degree to which an SLO is utilized varies by microservice. The Item Team didn’t have any SLO graphs, so SLOs weren’t really being used there. The first thing I did once I was embedded with this team was to work on visualization.
You can read more about SLOs and error budgets in the "Implementing SLOs" section of the Site Reliability Workbook.
In order to visualize SLOs, I introduced the SLO Dashboard, which is developed by the Merpay SRE Team. The graph below shows the error budget generated using this system.

Introducing SLO Dashboard has allowed us to make use of SLOs in two major ways.
First, we began taking error budgets into consideration in making release decisions. We can check our error budget prior to release and make decisions accordingly (for example, we can decide not to make a release with major changes if a large chunk of our error budget has already been used up).
Second, we can use the SLO Dashboard to check error budgets up to three months prior, allowing us to see whether a quarterly fork has had any major negative impact (whether it has used more of our error budget).
Besides improving how we use SLOs, I also added SLIs. The Item service has an asynchronous process it uses to update the search index whenever product information is added or updated. We originally monitored the number of queues for asynchronous processes. This is a valid means of detecting when an entire asynchronous process fails, but would not detect other issues such as a single process slowing down.
In order to monitor an indicator closer to the user experience, we made it possible to use our metrics to obtain the time from when a product is updated to when the search index is updated, and to monitor this as an SLO.
2. Introduction of Istio to the Item service
At Mercari, we use Istio as our service mesh. It was actually the Microservice Team that first implemented Istio at Mercari. Using Istio can increase the reliability of communications between services, which is why the Microservices SRE Team decided to go ahead with introducing it.
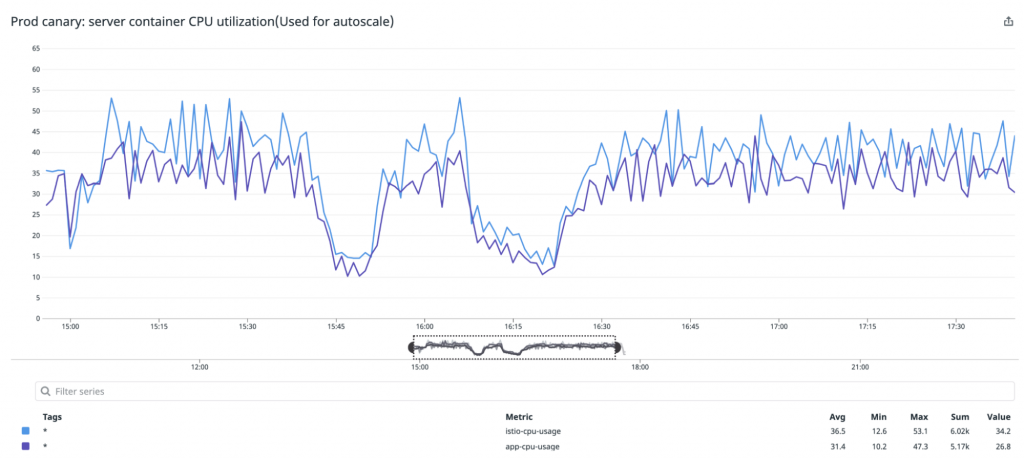
One point of concern in introducing Istio was that the Item service is a microservice that receives a very large number of requests, and so we didn’t know how many resources would be required for the istio-proxy container. We therefore initially configured it so that the istio-proxy container (configured with plenty of CPU and memory resources) would start with only one pod (a canary pod). We ran this pod for one day to confirm what kinds of resources would be used in a production environment.
Running the istio-proxy container turns the pod into a multi-container. However, the CPU utilization of the pod itself is used as the CPU utilization for HPA. If the CPU utilization increases only on a single pod, that means it is not being scaled out appropriately. We therefore use Datadog External Metrics to perform HPA based on CPU utilization for each container, allowing us to scale out/in properly. We then adjusted resources so that each container would have around the same CPU utilization. That way, scaling could be performed without issue even if an outage were to occur and prevent metrics from being retrieved from Datadog.
Thanks to this process, we were able to begin using Istio without issue in the Item service. However, we have yet to realize the full benefits of using Istio.
For example, in order to use VirtualService weight to shift traffic, Istio must be enabled on all caller microservices. Istio has not been enabled on all services that use the Item service, so we cannot use Istio for a canary deployment. However, making more use of Istio throughout all of Mercari is crucial so that we can use its features to the fullest extent. I think it’s worth it for other Microservice SRE Team members to enable Istio in their embedded teams as well.
3. Mercari API GKE migration
Mercari microservices run on GKE, which is provided by the Platform Team. Mercari API had previously run on GCE. However, we are currently working on a project to migrate this to GKE (on which our microservices run), which would allow us to use the same tools we use for developing microservices and deliver the same developer experience. I joined this project while it was already in progress. Mercari API contains various components (server/worker/cron, etc.), so we are migrating them one after another.
The basic server and worker Kubernetes resources had already been created when I joined the project, so I worked on adding and improving settings for operation and monitoring in the production environment. More specifically, I adjusted server and worker resources to support requests in the production environment, and added settings for HPA and Datadog integration. We can now view metrics (such as for Nginx and Apache) and see differences in each release version.
I also participated in switching the servers in the production environment, and since December of last year we gradually increased traffic in the environment on GKE from 1% to 5% and then 10%. I also responded to and investigated any issues that occurred.
I’ll provide a brief explanation of the biggest issue we encountered.
We were seeing a lot of "connection resets by peer" from five to 15 minutes past the hour, every hour, in communications from Nginx (GCE) to GCLB to Mercari API (GKE). There wasn’t any overall increase in the number of requests, either for Mercari API as a whole or in any specific endpoint during these periods. There also weren’t any batch processes running, so we really had no clue what was going on for a while.
We investigated this with the Network Team and GCP Support, and found that we had reached the "maximum number of VM instances per internal backend service" for GCLB during periods when we were experiencing this issue. This was occurring at the same time each hour because a CronJob has been configured to restart the pod each hour, in order to prevent memory leaks in other services using the same GKE cluster. This resulted in heavy resource usage, which caused the Kubernetes node to scale out and reach the maximum number. In order to resolve this, we had GKE cluster subsetting enabled, and then recreated the LB.
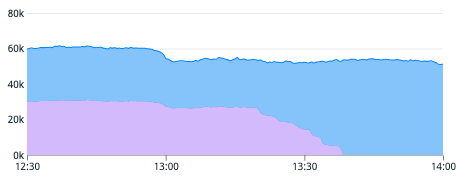
We were finally able to finish migrating to GKE in February.
The graph below shows the ratio between GKE and GCE switching from 50:50 to 100:0.
We are currently migrating our cron jobs to Kubernetes CronJobs using Kubernetes Kit(k8s-kit). As mentioned before, you can configure even a complicated feature, such as Workload Identity, simply by adding a single line like the following.
workloadIdentity: truek8s-kit abstracts the Kubernetes manifest, allowing you to omit various settings that normally would need to be manually added. For example, we know enabling Workload Identity can cause timeout errors at pod startup, so we need to handle this somehow. In addition to generating settings related to service accounts, k8s-kit can also generate settings for an initContainer waiting for GKE metadata server preparations to finish. A team that has started using k8s-kit to write service settings would be able to avoid this issue even if they are unaware of it.
k8s-kit uses CUE as its configuration language. Users can be a bit resistant to writing their own settings wrapped in Kubernetes yaml. However, the default settings have been improved over time as many teams use k8s-kit and provide feedback on their experiences. I think the overall benefits are great, as long as you can take certain types of feedback (the results of individual teams encountering issues and the Platform Team’s best practices) and apply them to the settings used by all teams.
Summary
In this article, I introduced three of my duties as an embedded Microservices SRE.
The two services I’ve worked on as an embedded team member differ greatly from one another. The Item service generally follows Mercari microservice rules, so we can make use of platforms to make improvements. In contrast, the Mercari API service was developed a long time ago, and the logs, monitoring methods, and even the development language are different, so we cannot use platforms provided for all of our microservices or libraries being used internally within Mercari.
Going forward, I’d like to continue to work together with service developers as an embedded SRE in promoting the use of platforms and resolving issues that cannot be resolved with platforms alone.