* This article is a translation of the Japanese article written on December 16, 2021.
This article is for day 16 of Merpay Advent Calendar 2021.
Hello everyone. This is foostan from the Merpay SRE Team. Most of the time you’ll see me talking about keyboards, but my actual job is on the SRE Team as a software engineer and engineering manager (EM).
One of the most important roles of the SRE Team is to increase service reliability and ensuring that Merpay is available for use at all times. Configuring systems so that services don’t stop is an important part of increasing reliability. It’s also important to raise appropriate alerts to notify all stakeholders if a service error occurs. In this article, I discuss how to implement practical alerts based on user impact.
What are appropriate alerts?
Let’s start by considering what kinds of alerts we should be raising. One reason for raising alerts would be to detect a service error quickly in order to minimize impact to users. Here are some appropriate types of alerts:
- Alerts to notify people quickly when an error has occurred with user impact
- Alerts to allow people to take action quickly, such as restoring the service or determining causes
The hard part is determining what exactly "user impact" is, how to measure it, and how to determine what an error is. These are all abstract and subjective concepts. I’ll be covering them later on in this article.
Too many alerts can reduce productivity or even become a health hazard
What would happen if alerts are not raised appropriately? Here are some examples of inappropriate alerts:
- Alerts that cannot detect a service error, or alerts that are not raised fast enough
- Too many alerts (especially when many require no action)
Regarding the first type of alert, even though you have implemented the monitoring setting, it’s meaningless if it doesn’t work. This is clearly not appropriate, and could reduce service reliability.
How about the second type? You might think it’s worth raising as many alerts as possible, to make sure that you don’t miss anything. However, having too many alerts can reduce their meaningfulness, and I’ll bet there are plenty of people out there who have missed an important alert because there were simply too many alerts being raised.
There are several major downsides to having too many alerts, including reducing the quality of the monitoring organization/system, reducing focus, reducing productivity (due to increased operational cost), and impacting health (due to responding to unnecessary alerts late at night). It is crucial to reduce the number of unnecessary alerts and keep service operations healthy, in order to keep a service running with stability.
Reliability definition and target
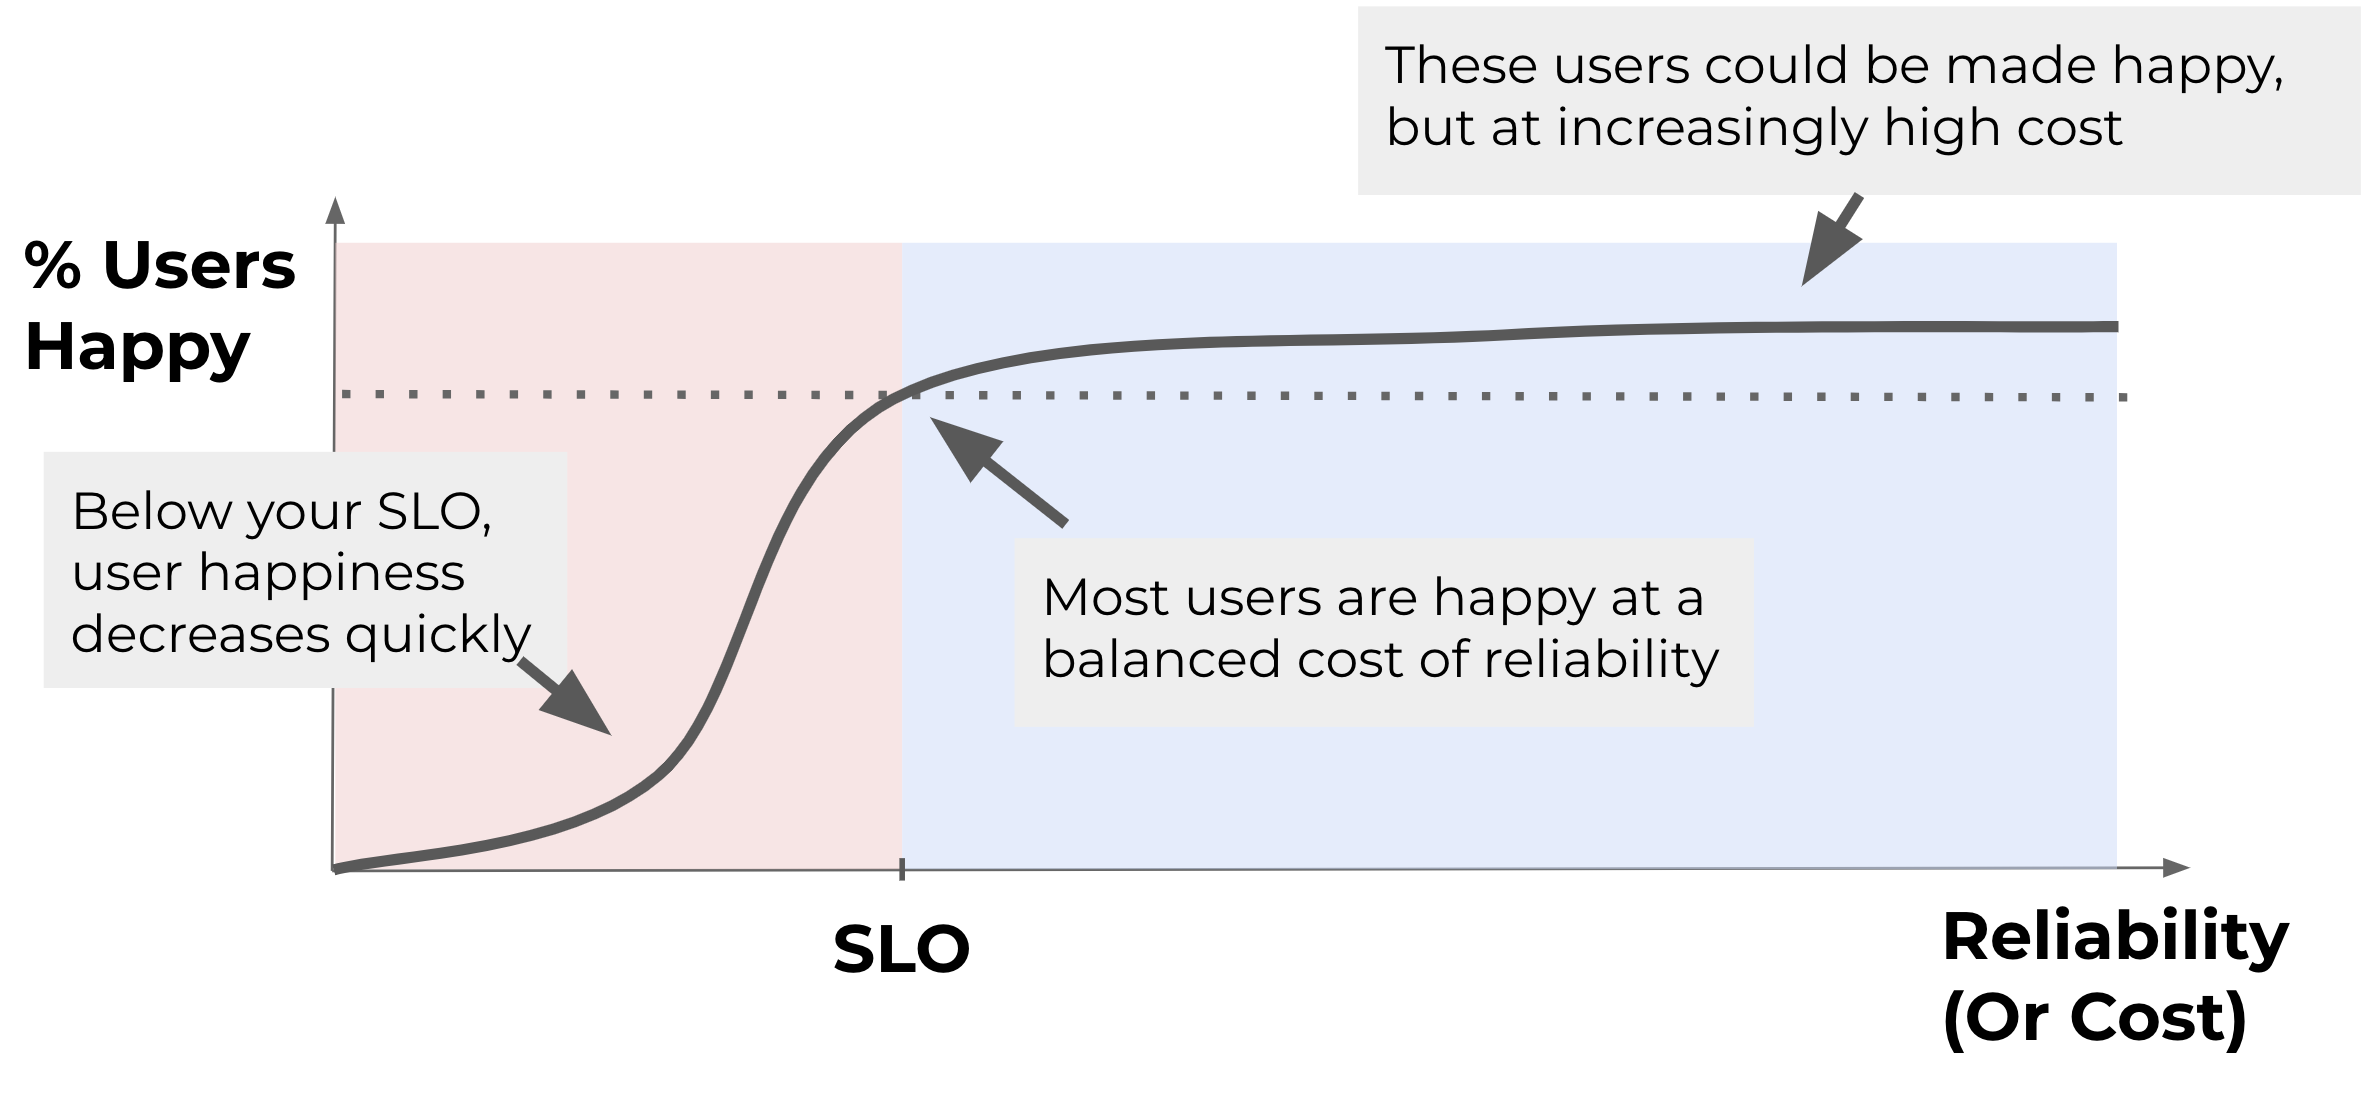
Let’s go back to the concept of "user impact," which is an indicator used for raising appropriate alerts. The following diagram shows the relationship between user happiness and service reliability.

* Reproduced from Shrinking the impact of production incidents using SRE principles—CRE Life Lessons The optimal SLO threshold keeps most users happy while minimizing engineering costs.
Users of a service want the service to run with stability and a high level of reliability. That seems like a reasonable request, but it is impossible to provide a service that never stops. The reality is that increasing reliability incurs a corresponding cost, such as setting up a multi-region configuration to keep services running during a disaster, or setting up a multi-cloud configuration to stay up when there is a cloud service outage. Therefore, it’s important to identify a good balance between cost and the level of happiness users expect, and to set this point as the target value for reliability. It’s difficult to set the right target value right away, so it will need to be reviewed regularly.
In order to raise alerts when user impact is detected, we must quantify related elements and handle them systematically. The concepts of SLIs, SLOs, and error budgets can be used here.
SLI (Service Level Indicator)
These are indicators used to measure service reliability. It’s important to select indicators that can measure user happiness in numerical terms. Some examples might include:
- Ratio of successful requests
- Ratio of requests completed within 100 ms
We should select SLIs like these, that allow us to make a clear distinction between results that are good and those that are not good, so that we can use the ratio in our measurements. When selecting SLIs, we must carefully consider what causes changes in service qualities or user happiness. This is another element that needs to be reviewed regularly.
SLO (Service Level Objective)
Once we’ve decided what to measure, we then need to determine specific target values. Some examples might include:
- A 99.9% ratio of successful requests over 30 days
- A 99% ratio of requests completed within 100 ms over seven days
Like in these examples, it’s important to set both a ratio (%) and period to achieve for each SLI. As I mentioned above, it’s difficult to set the right target values right away. You should set target values but leave some leeway for adjustment. For Merpay, we’ve already determined default values to set based on service importance, but we do set opportunities to review and adjust these values regularly.
The periods set here will also vary depending on service qualities. One way to make operation easier would be to align them with the interval set for reviewing SLOs. They should be reviewed frequently upon release, so it’s a good idea to set the period to seven days. This can be changed later on as the service stabilizes, such as extending it to 30 days. If you will be using the error budget concept (explained next), this will have a connection with development priority, so it’s a good idea to set the schedule in line with your development sprints.
Error budget
This is the error-related ratio permissible for an SLO. This permissible range is treated as a "budget," where we can implement measures with some degree of risk (such as releasing new features), as long as there is still room in the budget. However, if the error-related ratio increases and our budget runs out, we would stop releasing new features and begin implementing measures to restore reliability. Using an error budget in this way allows you to more easily take on new challenges, while maintaining reliability.
Let’s consider a specific example of an error budget. We’ll use the following conditions:
- SLO: 99.9% ratio of successful requests over 30 days
- Request frequency: 100 per second
We can calculate our error budget as "Total no. of requests × (1-SLO)." In this example, this is:
- 100 60 60 24 30 * (1-0.999) = 259,200
In other words, we can permit up to 259,200 error requests over 30 days. Here are some specific examples of using up our budget:
- Error ratio reaches 100% due to deployment mistakes (100 errors occur per second)
- 259,200 / 100 = 2,592 sec. = 43.2 min.
- Error ratio reaches 1% due to bugs (one error occurs per second)
- 259,200 / 1 = 259,200 sec. = 3 days
This shows that the budget will be consumed more quickly by more severe outages.
User impact and alerts
What does user impact actually mean?
So far, I discussed the relationship between user happiness and reliability, as well as SLIs, SLOs, and error budgets to quantify reliability. Now, let’s discuss what "user impact" specifically means, and consider the types of situations where we can determine that user impact has occurred.
- The error budget has run out
- SLOs are reliability targets, and user happiness would be significantly reduced if these are not met. This situation would clearly result in user impact.
- An outage has occurred and all requests result in errors
- Being unable to use a service would clearly reduce user happiness. There would be user impact even if this was restored after 10 minutes and we still had some error budget remaining.
- Errors occur constantly at a 0.01% ratio for some reason
- If an error is obviously occurring, you would think it would result in user impact. However, a 0.01% error would fit within our permissible range if we consider its impact on our error budget, so the impact on user happiness would also be minor.
As shown here, we can determine the approximate degree of "user impact" by calculating how much of our error budget is used when some kind of error occurs. We can then raise an alert if this permissible range is exceeded.
Burn rate
Burn rate is a method for expressing the amount of error budget used.
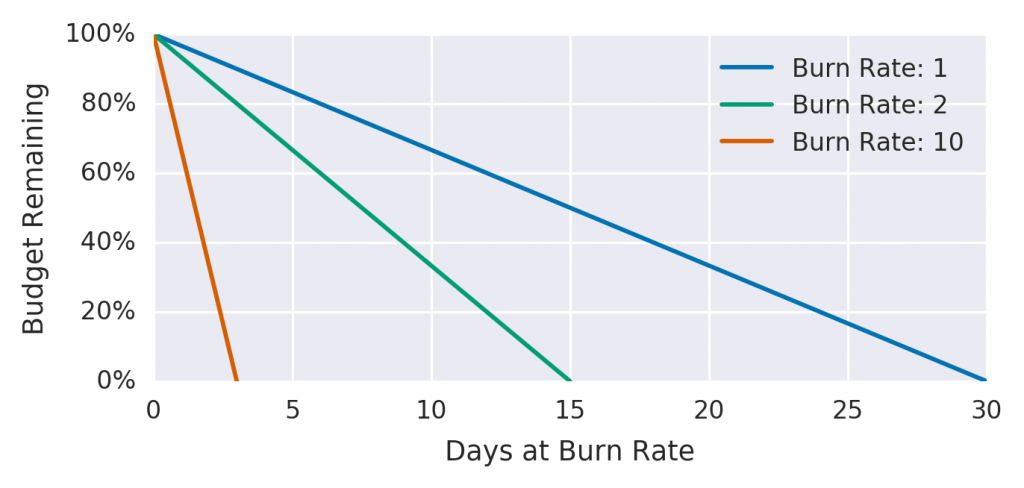
- Reproduced from The Site Reliability Workbook Figure 5-4. Error budgets relative to burn rates
This figure shows burn rate characteristics for a 30-day SLO. Burn rate is a ratio that shows the amount of error budget used, where a value of "1" indicates that the budget was used up during the period specified for the SLO. If the used amount doubles, the burn rate will be "2," which means that the budget will be used up in 15 days (half of the total period).
The criteria used to determine whether a user impact has occurred will vary depending on the qualities of a given service. However, this burn rate value can be used in raising alerts based on the degree of impact to users.
Configuration example using Datadog
Let’s cover an actual configuration example. We use Datadog for Merpay, so I’ll use Datadog for the configuration example.
SLI selection
Metrics used as SLIs must be capable of measuring the degree of impact on users, and selecting appropriate SLIs is the crucial first step in this process. For example, let’s consider a simple web service. We should be able calculate the ratio of normal requests from load balancer metrics, and use the response time.
At Merpay, we set individual SLOs for each microservice, and use a proprietary implementation to gather communication logs between services for use as custom metrics. In the near future, we should be able to gather the same metrics from logs for Istio and other service meshes.

* The Go gopher was designed by Renée French.
If using Datadog APM, one good option would be to use trace log metrics. For example:
- trace.grpc
- trace.grpc.hits
- trace.grpc.errors
We can use these metrics. More details on this can be found at https://docs.datadoghq.com/tracing/guide/metrics_namespace/. Note that trace logs are output only when processed by the application, and any outages where requests do not arrive at the application cannot be detected.
SLO configuration
After selecting SLIs, the next step is to set SLOs based on documentation. I won’t be covering the configuration in detail here. However there are two types of SLOs:
You will need to understand the characteristics of each prior to making your selections. More details can be found in related documents, and in GCP’s documentation. The important thing to keep in mind here is that the ease-of-use differs between the two types due to whether the implementation is based on requests (metric-based SLOs) or based on time (monitor-based SLOs). Note also that there are some cases where metric-based SLOs cannot be used, depending on the metrics being handled.
Burn rate alert configuration
In early last month, a public beta of Datadog was released that allows burn rate alerts to be used.
A document that covers details on configuring this has already been prepared. https://docs.datadoghq.com/monitors/service_level_objectives/burn_rate/
There are three major settings for burn rate alerts.
- Target SLO
- Evaluation window (a short window will be automatically entered once you enter a long window)
- Alert threshold value (burn rate)
The burn rate is calculated during the long/short window period for the target SLO, and an alert will be raised if the threshold value is exceeded. The document mentioned above covers windows and recommended parameters. You can find a detailed explanation of multiple burn rate alerts in The Site Reliability Workbook (5: Multiple Burn Rate Alerts). The Datadog implementation uses multi burn rate alerts, which you will see when configuring the two long and short windows.
Multiple burn rate alerts are configured to implement multiwindow and multi-burn-rate alerts as discussed in The Site Reliability Workbook (6: Multiwindow, Multi-Burn-Rate Alerts). However, if multiple of these are set, a notification will arrive from each. You’ll need to make clever use of a composite monitor or similar tool in this case.
The following example Terraform code uses a composite monitor to configure multiwindow and multi-burn-rate alerts.
resource "datadog_monitor" "slo_monitor_composite" {
  name = "SLO sample - Burn rate Composite"

  type = "composite"

  query = "${datadog_monitor.slo_monitor_burnrate_14_4.id} || ${datadog_monitor.slo_monitor_burnrate_6.id}"

  message = <<EOM
    *A lot of the Error budget has been consumed*: [SLO Status & History](https://app.datadoghq.com/slo?slo_id=${slo_id})
    *Please confirm Customer Impact, Investigation, and Mitigation from playbooks.

    @slack-alert-channel
  EOM
}

resource "datadog_monitor" "slo_monitor_burnrate_14_4" {
  name = "SLO sample - Burn rate: 14.4, Long-window: 1h, Short-window: 5m"

  type = "slo alert"

  query = <<EOT
    burn_rate("${slo_id}").over("30d").long_window("1h").short_window("5m") > 14.4
  EOT

  monitor_thresholds {
    critical = 14.4
  }

  message = "Example monitor message"
}

resource "datadog_monitor" "slo_monitor_burnrate_6" {
  name = "SLO sample - Burn rate: 6, Long-window: 6h, Short-window: 30m"

  type = "slo alert"

  query = <<EOT
    burn_rate("${slo_id}").over("30d").long_window("6h").short_window("30m") > 6
  EOT

  monitor_thresholds {
    critical = 6
  }

  message = "Example monitor message"
}
The composite monitor query uses an OR operation to calculate each burn rate alert, so only one notification will arrive regardless of whether a single condition or multiple conditions are detected.

Summary
In this article, I provided a brief introduction on the methods and concepts involved in detecting user impact and raising alerts. I also briefly covered the relationship between user happiness and service reliability, and how to raise alerts based on SLOs. I also provided a configuration example.
Setting appropriate alerts is important, not only for users of the service, but for those of us developing and operating services. I hope this article will get people to rethink service SLOs and alerts.