This post is for Day 4 of Mercari Advent Calendar 2023, brought to you by @fp from the Mercari mobile architects team.
Last year when we launched our GroundUP project, we were facing a daunting challenge: serving millions of users equally or better than before, using different technologies and different architectures.
When launching a completely rewritten app, it should at least perform equal or better than the previous version.
The first period after launch, the priority is always to look after crashes, it’s a clear indication that something is not working.
But crashes are not the only issue to look after, sometimes a slow app can be even worse.
The app doesn’t crash, but it’s not meeting expectations for the customer, and this issue might go unnoticed for a long time.
Even when customers report bad performances, it is a common mistake to attribute it to external circumstances: bad connectivity or a device not meeting requirements for example.
We couldn’t accept that, we wanted to deliver the best experience to our customers, and that meant no crashes and good performances.
So we needed to measure it. Measure all we could.
This eventually led us where we are today: end-to-end tracing, performance drop alerts, performance monitoring dashboards.
Let’s get into the details on what we did to arrive where we are today.
The problem
Near the end of our GroundUP project development, we started beta testing the new app.
As expected, various issues emerged and the team focused on fixing crashes as well as addressing the feedback received from the beta-testers.
One kind of feedback we were receiving was about performances: some users were reporting the app to be slow, less responsive than the previous version.
While in some cases, the issues were noticeable and easy to reproduce, there were feedbacks we could not reproduce.
Due to the project using a different tech-stack and architecture, and due to the fact that we leveraged new technologies such as SwiftUI and Jetpack Compose, we were expecting some performance degradation.
After expanding the beta to more users, the situation did not improve, and we started to receive more feedback about performances; something had to be done.
Starting to measure performances
The first step we took toward improving performances was to measure the differences between the old app and the new app.
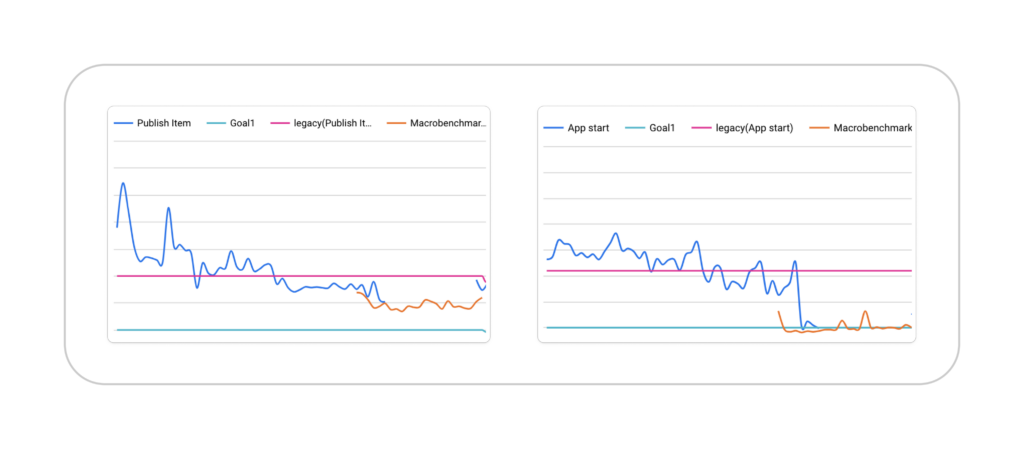
We identified 9 core business scenarios where it should be critical to have a performant and smooth experience, and manually measured the time it took to load them. A very rudimentary approach but simple and effective.
In some cases the differences were substantial: the old app was clearly faster.
We focused on improving performances, for the next few weeks, our engineers were able to optimize and improve the code.
Eventually the performances improved significantly, but it was still not as good as the old app, and this was not enough.
So we decided to tackle this issue from different sides:
In-house performance measuring and benchmarking: before every weekly release, performance measurements were taken and compared with previous results. If performances were not meeting our thresholds, the release would be blocked.
Production performance monitoring & alerting: to understand what our customers are experiencing and get notified if performances are not up to our expectations
This was the beginning of a long journey but allowed us to make a plan and focus on monitoring and improving performances, something that is now part of our development process.
In-house benchmarks
The first benchmarks were really just people using a timer and measuring the load time in various scenarios.
Clearly this was a temporary measure while we were developing tools to collect the measurements automatically.
We run this benchmark every week, before each release.
Initially, we were comparing the measures with the old app, and once performances started to align, we started to compare the results to the previous week one.
This was necessary to guarantee that no performance regressions would be introduced in the new release.
In case of performance spikes, we might decide to block the release.

Production performance monitoring
In-house benchmark was a great first step, but it wasn’t enough.
One of the downsides of In-house benchmarks is that they are executed in a controlled environment. While this is perfect for detecting regressions, it doesn’t reflect real-world experience.
Our goal was to be able to monitor performance in production, and measure everything that happens on the screen from API calls to rendering to animations.
We investigated different services that provide performance monitoring, and eventually we settled for Datadog RUM.
The main driver for this decision was the integration with the backend: since Datadog was already being used there, we could leverage it.
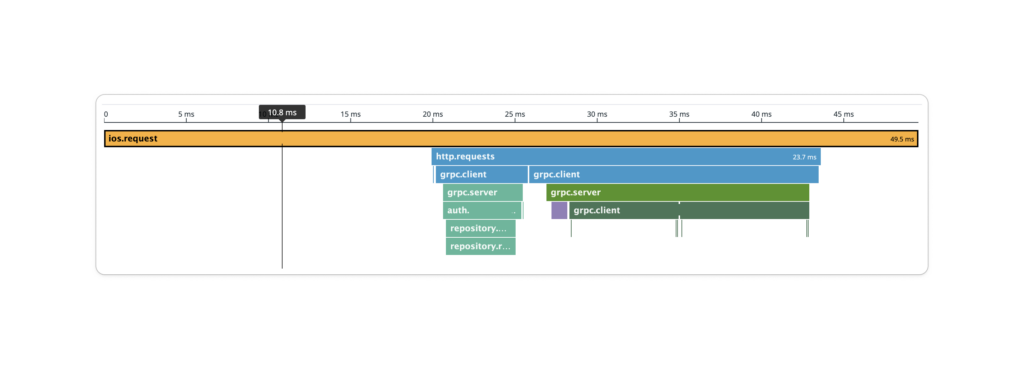
The integration with the backend allowed us to have a comprehensive view of the performance from client to server.
Having the ability to exactly pinpoint where the performance issue is, it’s an invaluable tool.


We were now able to understand and monitor user performances in production.
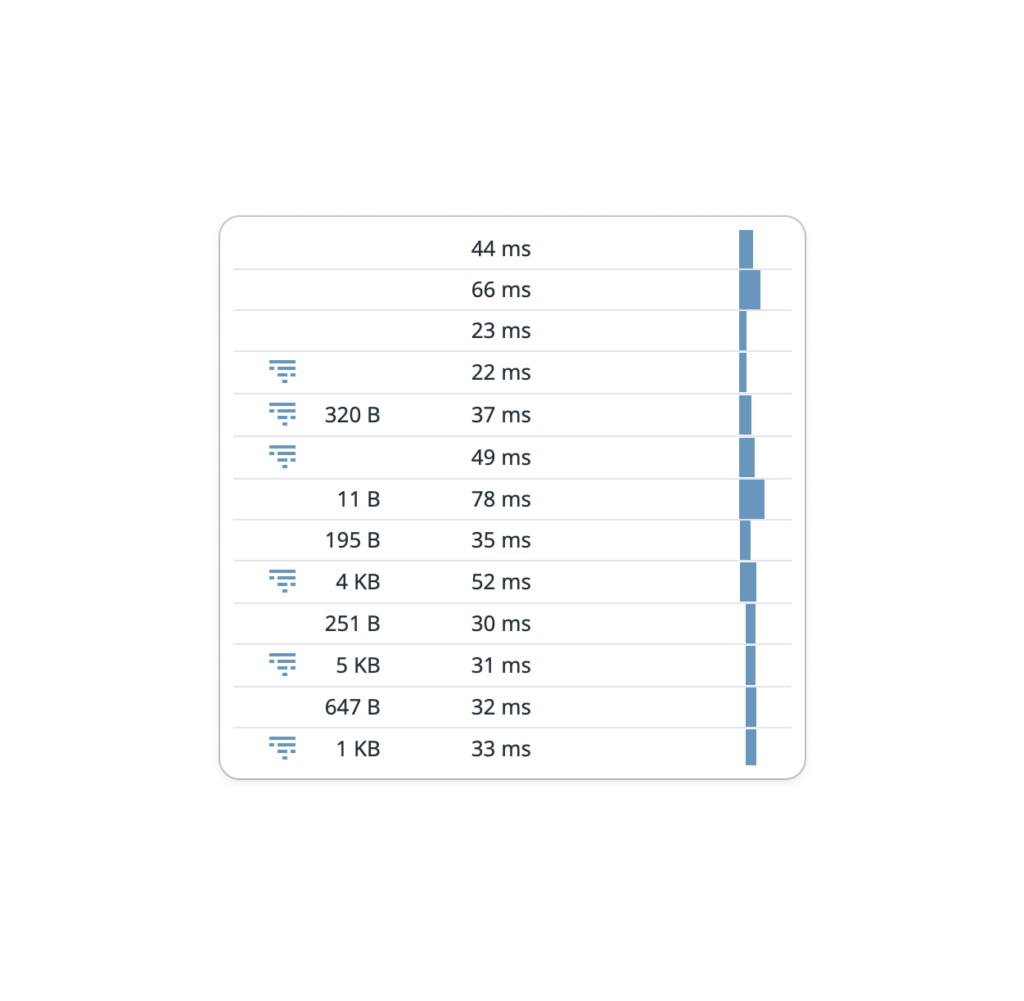
We implemented performance monitoring in our major screens and it allowed us to have a breakdown of all API calls, and understand where slow performances were coming from.
Is the screen rendering slow? Or maybe the client APIs are unresponsive and take a long time to return the data? What about our micro services? We can now check it all.
We started to set up dashboards, highlighting screen performances and creating a baseline.
From that baseline we started setting up alerts that alert us if performances are degrading.
It allows us to quickly jump on the issue and address it.
What’s next?
The next step is to set performance SLOs and target metrics. This will allow us to guarantee an optimal performance across all the screens.
There are also plans to increase the scenarios and metrics monitored, to have a better overview of production performance.
For Android specifically, automated baseline generation is in the pipeline.
Finally, improving the development flow by leveraging all these metrics, this is an ongoing process with the aim of continuously finding the best outcome.
Tomorrow’s article will be by @t-hiroi. Look forward to it!


