This post is for Day 02 of Mercari Advent Calendar 2023, brought to you by @pratik from the Mercari Web Platform team.
This article will explain how are we saving so much cost by migrating away from our Dynamic Rendering Service (aka Prerender) to Server Side Rendering (SSR) (aka Web Suruga SSR)
The migration project initially started as a FinOps Initiative to save cost but it turned out that Google is also not recommending Dynamic Rendering Solution for SEO anymore https://developers.google.com/search/docs/crawling-indexing/javascript/dynamic-rendering
Also this article will mainly focus on the infrastructure details of this migration. There was a Big SEO Impact & a lot of interesting challenges on the frontend side like why we chose Next.js SSR, etc. Mercari Web Architect team will be publishing an article about it tomorrow!!!
If you are curious about Prerender, My team member have written a wonderful article explaining how we implemented Prerender: https://engineering.mercari.com/en/blog/entry/20220119-implement-the-dynamic-rendering-service/
Prerender is used to serve only Bot’s Requests like Google bot (no user traffic) so, we have a rate-limit on prerender to make sure it doesn’t get spammed with requests
Technical Insights of Prerender Removal Process
This section will explain the process we went through & issues we faced when removing Prerender from Infrastructure Perspective
Load Testing
It is very important to have some SLO (Service Level Objective) in mind for your service, which helps in modifying the resources during Load Testing. This makes sure you are not just playing with the resource requests & limits when doing Load Testing.
The main SLO for Web Suruga SSR Service was p90 Latency always less than 500ms (spoiler, we ended up achieving ~350ms 🎉) (for Prerender the p90 Latency was ~2.7sec)
We Created Mock Server for API & Mock Deployment of Frontend to Perform the Load Test.
We chose not to do Load Test on the Dev environment because we have a very complicated dependency on multiple microservices so scaling up & down every microservice during Load Test is almost impossible.
We know this approach doesn’t replicate production well but in our case it worked out fine!
We used the loadtest npm package to run Load Test because it provides all the necessary features & it’s much stable!
We tried Hey & ab for Load Test but they did not meet our needs, we want to try k6.io in the future & see how it goes
Target URL:    [REDACTED]/search?keyword=%E6%9C%8D
Max requests:    180000
Concurrency level:    1
Agent:    keepalive
Requests per second:    [REDACTED]

Completed requests:    180000
Total errors:    0
Total time:    301.06053639600003 s
Requests per second:    [REDACTED]
Mean latency:    87.5 ms

Percentage of the requests served within a certain time
  50%      69 ms
  90%      148 ms
  95%      193 ms
  99%      301 ms
 100%      11590 ms (longest request)
We followed multiple combinations of strategies for doing Load Testing as follows,
Load Testing Strategy based on Pods
You start with the Single-Pod Load Test, Single-Pod Load Test is very straightforward, you just try to squeeze as much output as possible from 1 Pod while targeting SLOs & keeping the resources as low as possible.
Just multiply the number of pods based on the traffic one Pod was able to handle in proportion which will cover your target requests per second, and that will be the number of Pods you need.
It is also important to run proper Load Test when having multiple pods, as this lets us know if the traffic/load is distributed evenly between pods! (I like to call this Multi-Pod Load Test but its just an extension of Single-Pod Load Test 😅)
Load Testing Strategy based on Pages
Since every page (or URL) has a different set of apis, page size, etc. This results in different latency & resource requirements for each page.
So, it is very important to run Load Test on each page separately to get worst case data & also its important to run Load Test on multiple pages in-parallel to reflect Production traffic & get more realistic data!

Horizontal Pod Autoscaling (HPA)
Since the traffic from Bot fluctuates a lot, We don’t want to keep too many pods alive if they are serving very small traffic and vice-versa.
We have min & max values to make sure the deployment doesn’t reduce or increase the number of pods too much, eg
minReplicas: 2
maxReplicas: 100
We have a slow Scale Down & a fast Scale Up strategy mainly based on CPU Utilization, eg
scaleDown:
  policies:
    - periodSeconds: 90
      type: Percent
      value: 2

metrics:
    - resource:
        name: cpu
        target:
          averageUtilization: 80
          type: Utilization
      type: Resource
Monitoring
For Monitoring we use Datadog, and for Datadog APM (Tracing) we use the Datadog official dd-trace npm package.
Since we implemented Web Suruga SSR using Next.js, there is an issue with Next.js SSR that datadog tracing doesn’t work with the in-built Next.js Server
More Context here: https://github.com/vercel/next.js/discussions/16600
Considering our case, we decided to implement our own custom express server to fix the above issue. As this was the simplest & least time consuming solution.
const nextHandler = nextApp.getRequestHandler();

async function handler(req: Request, res: Response) {
  try {
      await nextHandler(req, res);
    } catch (err) {
      res.statusCode = 500;
      res.end('internal server error');
    }
}

const app = express();
app.all('*', handler);
Release Strategy
We followed a Gradual Release strategy like we started out with 1% of traffic migrated from Prerender to Web Suruga SSR, and then slowly migrated to 10%, 30%, and so forth.
We decided to do Page-by-Page release as it reduces some dependency from the frontend development, also There was a risk of providing inconsistent content to Google bot so, we had to make sure the gradual release didn’t take too long and having Page-by-Page release strategy really helped with that!
We used an HTTP Header to distribute requests between Prerender & Web Suruga SSR because using HTTP cookies requires lot of extra implementation and using Url Parameters can affect Google bot url rankings Also we are using Istio Ingress Gateway for routing & using HTTP Headers with it is really simple (spending too much time on this routing is not necessary since we need to remove it after whole migration)
if (randomint(0, 99) < 33) { # 33% Released
  set req.http.X-WEB-SURUGA-SSR = "true";
} else {
  set req.http.X-WEB-SURUGA-SSR = "false";
}
Impact & Conclusion
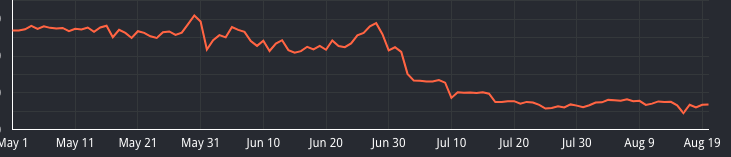
We were able to increase our rate-limit by 2x (to allow Googlebot to crawl more pages) while Saving our cost by more than 75%
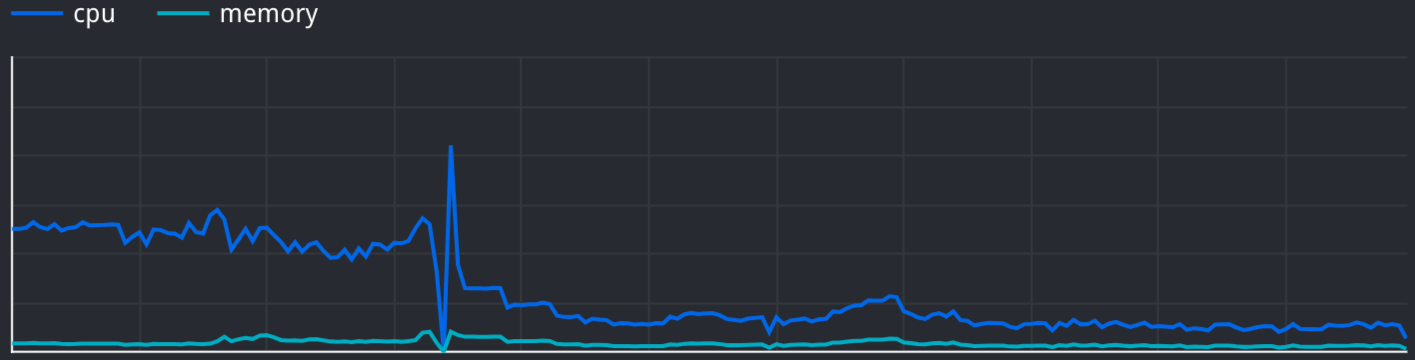
We reduced the number of CPU Cores used by 96%, and Memory used by 60% in Total.
A Huge Shoutout to all the Members of Web Platform team and Web Architect team for their support on this project!
Through this project we learned a lot of things but mainly we realized, doing load testing is really Important & Tricky at the same time and since there are a lot of new projects regularly being tried out in Mercari, a lot of teams in our company need to do load testing regularly. So, we will be working on providing load testing tools internally within Mercari in Future!
If you are interested in Projects like this and interested in joining our team, we have an Open Position in our team, be sure to take a look https://apply.workable.com/mercari/j/6DC732B8FE/
Tomorrow’s article will be by Mercari Web Architect Team. Look forward to it!