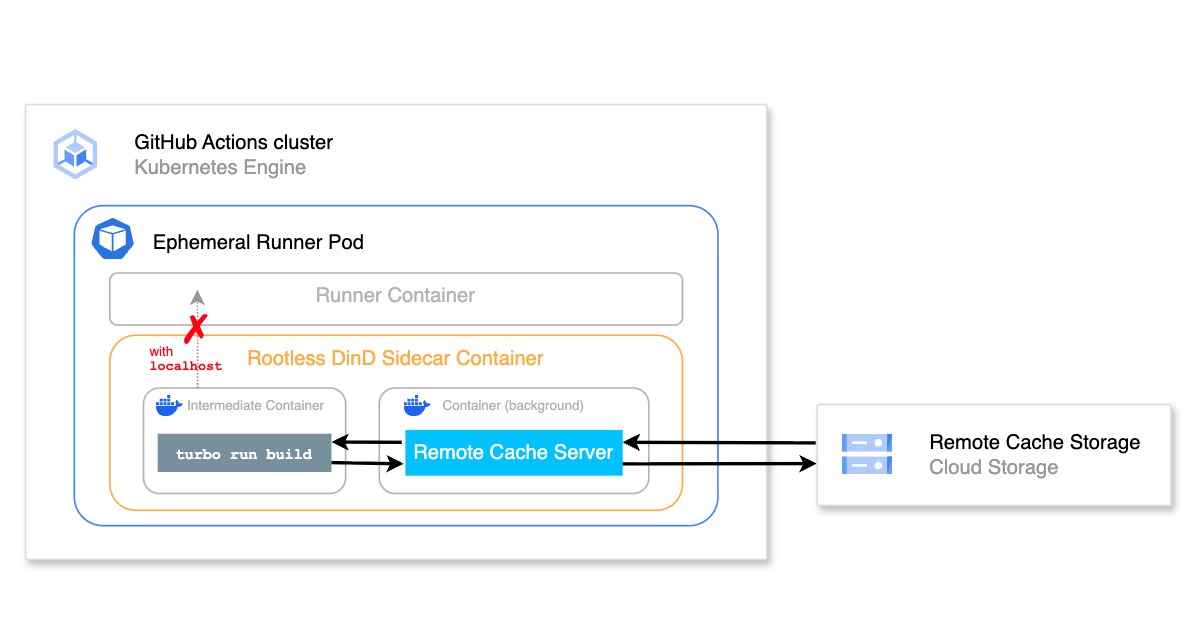
*This article is a translation of the Japanese article published on February 24th, 2022.
Hello. This is mtokioka from the Mercari Microservices SRE Team. My role on the team is Embedded SRE, which means I’m involved in tasks such as automation and improving service reliability.
At Mercari, we use Kubernetes Horizontal Pod Autoscaler (HPA) for pod autoscaling. However, there are some cases where autoscaling using supported standard CPU utilization is insufficient. In these cases, we can use Datadog metrics as our External Metrics to bring more flexibility to autoscaling.
We’ve actually already used several external metrics with HPA, so in this article I’ll cover the metrics we’ve used in the order we used them.
Case 1: CPU utilization per container
Individual pod values are used for CPU utilization in HPA. At Mercari, we use Istio—we currently have two containers (application container and Istio container) existing on the same pod. If resources are allocated unevenly between containers, scaling out won’t work as expected. We therefore configured HPA based on CPU utilization per container.
*Kubernetes v1.20 is now available to set CPU usage by containers as alpha feature. By using this feature, there will be no need to use External Metrics.This is configured as follows.
DatadogMetric definition (application container)
apiVersion: datadoghq.com/v1alpha1
kind: DatadogMetric
metadata:
  name: app-cpu
  namespace: sample-app
spec:
  query: >-
((avg:kubernetes.cpu.usage.total{kube_deployment:sample-app,kube_namespace:sample-app,kube_container_name:app}/1000000000)/avg:kubernetes.cpu.requests{kube_deployment:sample-app,kube_namespace:sample-app,kube_container_name:app})*100
DatadogMetric definition (Istio container)
apiVersion: datadoghq.com/v1alpha1
kind: DatadogMetric
metadata:
  name: istio-cpu
  namespace: sample-app
spec:
  query: >-
((avg:kubernetes.cpu.usage.total{kube_deployment:sample-app,kube_namespace:sample-app,kube_container_name:app}/1000000000)/avg:kubernetes.cpu.requests{kube_deployment:sample-app,kube_namespace:sample-app,kube_container_name:istio})*100
HPA settings
apiVersion: autoscaling/v2beta2
kind: HorizontalPodAutoscaler
…
spec:
…
  metrics:
  - type: Resource
    resource:
      name: cpu
      target:
        type: Utilization
        averageUtilization: 70
  - type: External
    external:
      metric:
        name: datadogmetric@sample-app:app-cpu
      target:
        type: Value
        value: 80
  - type: External
    external:
      metric:
        name: datadogmetric@sample-app:istio-cpu
      target:
        type: Value
        value: 80
DatadogMetric resources are defined in order to obtain the CPU utilization for each container. The applicable resource can be accessed from HPA settings.
We add the external metrics to the settings configured using existing CPU utilization. Now, if we were to configure HPA using only external metrics, HPA would stop working if there’s a failure in Datadog. However, by configuring things this way, we can scale out using existing CPU utilization even if we cannot obtain metrics from Datadog, improving the fault tolerance of the system.
You might have noticed that the judgement values for the external metrics are somewhat high. Although we designed this so that standard CPU utilization values are not obtained immediately after the pod starts, using external metrics means that values obtained from Datadog will be used as is, which would result in obtaining unstable values immediately after the pod starts. So, in order to reduce the impact of this kind of data noise, we set the values somewhat high.
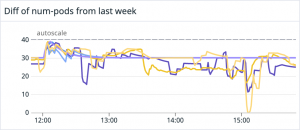
Case 2: Comparison with previous number of pods
Although extremely rare, there are occasions where we need to stop the entire site for emergency maintenance. This will cause requests to stop, which will trigger scaling in, and the number of pods will drop to the minimum level. Once maintenance is finished in this state, the system will be unable to process the sudden increase in requests, causing the pods to get stuck.
For this reason, we configured HPA to maintain a certain number of pods (to prevent scaling in below a certain threshold) by comparing the number of pods with the number from one week previous.
DatadogMetric definition
apiVersion: datadoghq.com/v1alpha1
kind: DatadogMetric
metadata:
  name: num-pods
  namespace: sample-app
spec:
  query: >-
    (50-
 20*(sum:kubernetes.pods.running{kube_namespace:sample-app,kube_deployment:sample-app})
/ewma_20(week_before(sum:kubernetes.pods.running{kube_namespace:sample-app,kube_deployment:sample-app}))
    )
HPA settings
apiVersion: autoscaling/v2beta2
kind: HorizontalPodAutoscaler
…
spec:
…
  metrics:
…
  - type: External
    external:
      metric:
        name: datadogmetric@sample-app:num-pods
      target:
        type: Value
        value: 40
We created external metrics based on a metric called kubernetes.pods.running, which is used to obtain the number of pods. This metric also counts any pods running during deployment, which causes a problem with extreme fluctuation. We first thought of using kubernetes_state.deployment.replicas_desired. However, the update frequency is low and this would cause the metric to expire, which would then cause the external metrics to be determined as invalid.
*On Case 3 which will be described later, we have extended the expiration date of the metrics. It might be better to use kubernetes_state.deployment.replicas_desired in that situation.Our external metrics have gotten somewhat complicated now, but here’s what we arrived at.
- We want to prevent "(Current number of pods) / (Last week’s number of pods)" from falling below a certain number
- Multiply by a negative value so that HPA is triggered when "greater than"
- Smooth out last week’s values to reduce the impact of the higher number of pods during deployment
- Add an appropriate constant to moderate the triggering of autoscaling
The actual data displayed on the Datadog widget is shown below. There are multiple graphs rendered here because there are multiple deployments. Creating a widget like this prior to applying actual settings can make it easier to get an idea of how the system will operate.

I mentioned moderating the triggering of autoscaling above; the following equation is used to calculate the number of pods in HPA.
desiredReplicas = ceil[currentReplicas * (currentMetricValue / desiredMetricValue)]The maximum value for our external metrics here is 50, and the trigger condition is 40. That means it will only be 1.25 times larger, even at its maximum. Our equation helps prevent this value from growing too large, which in turn prevents the number of pods from increasing too much when autoscaling is triggered.
Case 3: Number of remaining PubSub messages
I think that, oftentimes, PubSub used to perform asynchronous processing. We configured HPA based on the remaining number of messages so that we could somewhat control processing delay caused by too many unprocessed messages.
I’ll cover this very briefly here, but more details can be found in this article: Using Go to build and operate scalable workers using PubSub/Redis.
DatadogMetric definition
apiVersion: datadoghq.com/v1alpha1
kind: DatadogMetric
metadata:
  name: sample-app
  namespace: sample-app
spec:
  query: >-
    300 -
    100 * 100 * sum:kubernetes.pods.running{kube_namespace:sample-app,kube_deployment:sample-app}
    /
    (1 + avg:gcp.pubsub.topic.num_unacked_messages_by_region{project_id:sample-app,topic_id:sample-topic})
We assembled our metrics as follows. This is quite similar to Case 2.
- We want to keep "(Number of messages) / (Number of pods)" at or below a certain number
- The equation is more likely to diverge if the number of messages is used as the numerator, so we change this to the reciprocal
- Multiply by a negative value so that HPA is triggered when "greater than"
- Add an appropriate constant to moderate the triggering of autoscaling
We set the maximum value to 300 and the trigger condition to 200 for this equation, so it will only scale up to 1.5 times the number of pods, even at its maximum.
The data rendered on the Datadog widget is shown below. Batch processing creates a large number of messages, triggering autoscaling. However, this does not affect subsequent processing.

Note that we needed to use gcp.pubsub.topic.num_unacked_messages_by_region here and that there was a delay in obtaining our metrics. We therefore had to use an environment variable called DD_EXTERNAL_METRICS_PROVIDER_MAX_AGE to keep the metrics valid longer.
Summary
In this article, I discussed several actual cases of using external metrics. The key points are summarized below.
- External metrics can be used to bring more flexibility to HPA
- When using external metrics, combine this with scaling due to existing CPU utilization to provide fault tolerance
- Be mindful of metric validity
- You should use an actual widget to render your metrics
- Your metrics should be designed to moderate the triggering of autoscaling
That’s it! I hope this will help you to make better use of external metrics in your applications.