* This article is a translation of the Japanese article written on December 21, 2021.
This article is for day 21 of Merpay Advent Calendar 2021.
Introduction
Hello. I’m toshick, a frontend engineer at Merpay. In this article, I discuss what the Merpay Frontend team has been working on in regards to performance.
Overview
Performance when browsing websites has become increasingly important in recent years. Advocated by Google, Web Vitals are standard indicators for quantitatively visualizing browsing performance. You can use this score to determine the status of a site’s browsing performance and to begin making improvements.
That said, through my work I’ve learned that developing performance improvements can be difficult and costly. This is why I decided to write the support tool that is the subject of this article.
Lighthouse command (lhci)
The lighthouse command (lhci) is what I use to actually measure the performance of webpages. Made by the good people at Google, this command runs performance tests on a webpage and calculates a score based on Web Vitals. It determines how many milliseconds are actually required for a given metric (such as LCP), and outputs a json file indicating the results as a Web Vitals standard score out of 100.
Current status
The Merpay Frontend team currently uses Looker to visualize data, in order to monitor code coverage and performance. For performance, Web Vitals metrics are displayed in graphs, with a number of URLs targeted for each project.

As shown above, graphs are provided for each URL. Here, the horizontal reference lines (green) in the graphs indicate a target value, which is defined in Web Vitals (if the score is too good, the horizontal green line might not appear due to the scale of the display area). The blue bar graphs represent a score out of 100, so if the entire graph is covered in blue, that means the score is high. This use of color makes the graph easy to read. What the graphs above ultimately show for the URLs, is that the TBT score is quite low, which informs us of an area that needs improvement.
Issues
Looker graphs are poorly suited for use in confirming improvement iteration
- Looker graphs are fine for determining current performance, but they cannot be used for trial-and-error attempts to improve performance on local machines.
- This is because the results of the attempts will differ depending on whether they are run on CI or on a local machine, even on the same version of a site (because the machine specifications and network environments will differ).
- Looker graph data is generated by a machine on CI and executed late at night.
- Daily results are combined and totaled, and the results displayed on the screen are the average values of execution results over an arbitrary number of executions during a given month and day. This means that results cannot be pinpointed, even if an improved version on a local machine is pushed to CI (it will be merged with data run at a certain time [for example, 2:00 in the morning], so it will be unclear how much of an effect this improvement had).
- What this means is that we need to wait until the next day to confirm the score of the improved version and to see how much things have improved.
It takes times to confirm improvements locally
- lhci output results will vary to some degree, and so it’s risky to rely on the results of just a single execution.
- We see different results each time, even when we output results consecutively on the same machine. This means that we need to take the “average” of two (or more) execution results in the same environment as the current score.
- To make improvements, we have to compare the current score with the previous score. This has entailed the arduous task of manually calculating averages and taking notes while we worked.
What do we need to confirm improvements?
In order to confirm improvement results, we need to compare execution results on environments that are as similar as possible. We also need to cycle through the following steps in order to execute trial-and-error attempts in the local environment.
- Output the current score (average value over multiple executions). This only needs to be done once.
- Run the improvement multiple times and calculate the average score.
- Compare the two scores generated in steps 1 and 2 to verify the impact of the improvement.
This might seem quite simple, but keep in mind that we first need to write the current score down somewhere and then start trial-and-error tests to check for improvements. Here’s what the internal monologue of that process might sound like:
“Hey, the score improved!”
“Hmm... I can’t really tell if it’s improved after running it just once. I’ll try it again.”
“So, here’s the average of the two.”
“Now which one was the original score?”
“Wait, I should change this and run it again.”
“Hold on... which test went with this result?”
“Was this score after one execution, or the average of two executions?”
“Based on the previous execution, the score should’ve dropped here, but it seems like it went up. Wait! Isn’t this the score for that other improvement?”
You get the idea—it can be absolute chaos. Now, this wouldn’t be so bad if verification took only one second each time, but lhci doesn’t run that fast. It takes around 40 seconds to run an lhci test (set to two executions). This is how long it takes every time you calculate the average.
What we need from an improvement tool
Amid what can be a chaotic process, I have wondered whether history pages could be automatically generated. The purposes of using this tool are listed below:
- Display a graph of the average execution results over multiple executions to show the current status.
- Output a graph showing the average score calculated over multiple executions that can be used to quickly compare it with the current score.
- Run an improvement any given number of times and accumulate data.
- Add titles for future reference (for example, branch names).
- Confirm both the execution values for Web Vitals and the 100-point scores.
- Leave notes such as evaluation comments on each score.
- Output all of the above data in a single html file (that does not depend on an external store such as json).
Perf Local Check Tool
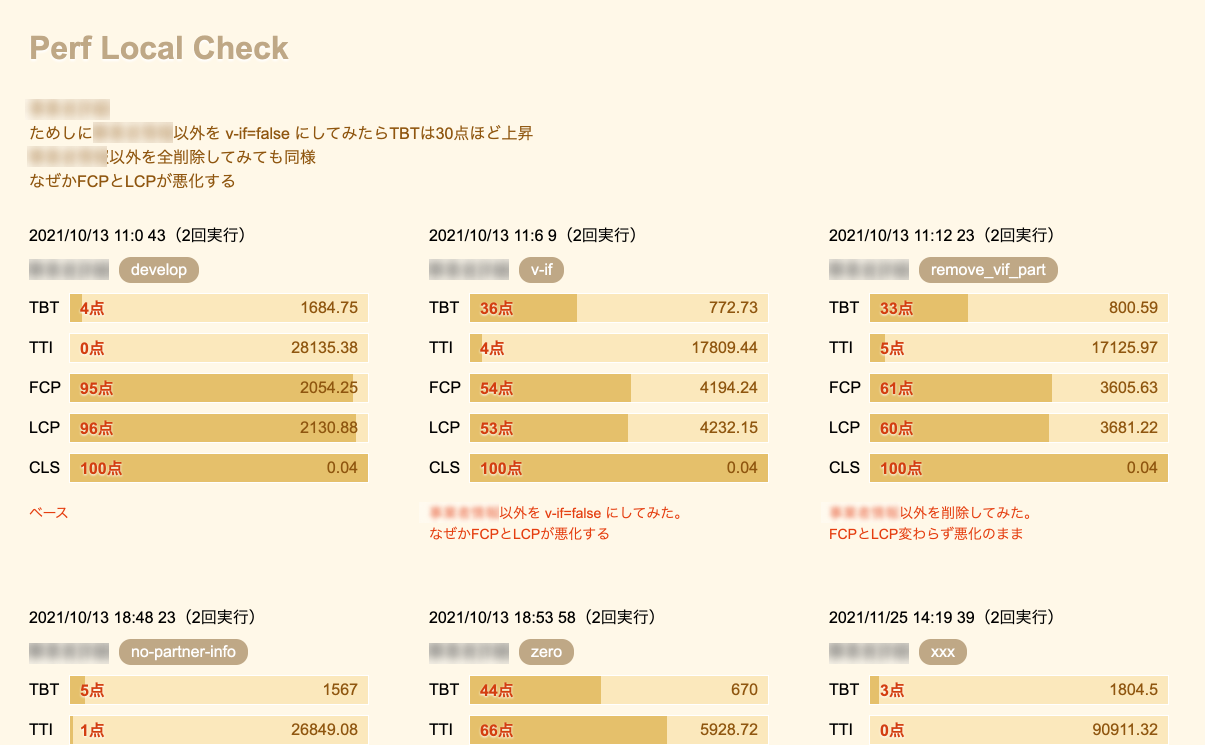
As a result, the tool I wrote will output an html file like the one shown below. I’ve tentatively called this mechanism the “Perf Local Check Tool,” but I’m still working on the name.
How to use Perf Local Check Tool
- First, load the target webpage so that it can be viewed (for example, http://localhost:9999).
- Enter the applicable URL in the lhci configurations file (.lighthouserc.js).
- Enter comments (with the character strings set as titles) as keys in the “description.js” file (during the build of the results html file, the tool will read this file and output the comments to an html file).
//description.js
module.exports = {
  page: 'XXX page',
  url: 'http://localhost:3000/merchants/72057594038927937/detail',
  // Overall notes
  memo:
    'XXX page\nAs a test, I set everything but vendor information to v-if=false, which increased TBT by about 30 points.\nDeleting everything but information has the same result.\nFor some reason, FCP and LCP yield worse results.',
  // Comments corresponding to title keys
  graphs: {
    develop: 'Base',
    'v-if':
      'I tried setting everything other than ZZZ information to v-if=false. \nFor some reason, FCP and LCP yield worse results.',
    remove_vif_part:
      'I tried deleting everything but ZZZ information. \nFCP and LCP still yield worse results.',
   ...
  },
};- A results html file containing the newly added graph block (with the title name “mybranch”) opens when the following command runs:
npm run local-lhci-html --title=mybranch(see the light-brown screenshot shown earlier in this article). - Look at the results and repeat the following process: Revise the product code, attach the next title, and then run the tool. This process allows us to review which attempts were successful and which were not. I find it’s a good idea to enter detailed comments in the “description.js” file to help others understand what is happening.
- The json files used as sources to generate html files will continue to be stored in the directory
“.lighthouseci-html”. If you want to develop a different page or reset everything, you can simply delete the“.lighthouseci-html”directory.
How the tool works
“Cast of characters”
- description.js
- this is a description text.
- make_lhci_result.js
- Outputs json files including the average lhci results, and outputs the results html files from all json files that are output.
- template-result.html
- Serves as the template for the result html files.
- .lighthouseci
- Serves as the directory that contains lhci command report json files. It’s cleared and regenerated each time it is used.
- .lighthouseci-html
- Serves as the directory that stores average score data json files for title names each time the tool runs. Average json data will accumulate unless explicitly deleted.
Explanation
- Run a test on the page the number of times described in the lhci settings. A result json file will be output in the “.lighthouseci” directory for each test.
- These are then read by “make_lhci_result.js” and a json file calculating the average result value is generated in the “.lighthouseci-html” directory.
- “make_lhci_result.js” continues to generate and output the result html files.
- The html files that are generated reflect the comments and other such content in the “description.js” file.
An average json file is output in the “.lighthouseci-html” directory each time the tool runs. These are read and an html file is generated each time, so the number of result graphs continues to increase. This functions as a history of results. To reset everything, simply delete the “.lighthouseci-html” directory.
Going forward
Using Perf Local Check Tool still doesn’t quite deliver a sense of immediate gratification that you have succeeded in improving a given metric in some way. However, I think I know what’s missing from the picture.
Generally speaking, we aim for the Green score that Web Vitals indicates (the ideal general score). However, this involves a lot of factors, so there are cases where we aren’t sure whether the score is immediately attainable. Instead of blindly aiming for a Green score, another option would be to set a more achievable goal. For example, if you delete the entire body of the page and still only get 40 points, you might set as your goal reaching 40 points without deleting the body.
I think the html files will be very useful in clearly indicating to other team members what you’ve tried, such as by indicating the current score for a page and explaining which metric you are trying to improve or what changes you are trying to make.
I hope other teams will use this tool, and I would like to eventually release it as an OSS once we have broken it in as a performance improvement tool.
I will continue to make improvements so that we can improve frontend performance at Merpay, at a low cost. Thank you for reading!