This post is for Day 2 for Mercari Advent Calendar 2021, brought to you by Yuji Kazama from the Mercari platform group.
Introduction
Hello, I am the Engineering Manager of the CI/CD platform teams in Mercari. Our teams are responsible for providing CI/CD platforms for microservices and other client applications.
In this article, I will explain how we have defined the metrics that we use in order to ensure that our CI/CD platforms continue to improve developer productivity across the company.
Why metrics are important in CI/CD
Continuous integration and continuous delivery (CI/CD) are fundamental practices for building a reliable and consistent product delivery lifecycle. A well-designed CI/CD pipeline allows development teams to have fast feedback loops and release software with confidence.
However, It can be challenging to understand what’s happening within CI/CD pipelines. We can’t improve on what we don’t measure. We must define measurable metrics so that we can make concrete strides towards making it better. In other words, metrics are an essential solution for any development team that wants to have visibility on issues in their CI/CD pipelines.
GSM Framework
First of all, we decided to use the Goals/Signals/Metrics (GSM) framework explained in the Software Engineering at Google because it forces us to think about which metrics will actually help us achieve our goals, rather than simply what we have readily available.
The GSM is a framework to guide metrics creation, and it encourages several desirable properties. It suggests creating Goals first, then Signals, and finally Metrics. The definition of each element is defined below:
- GOAL is the desired end result. It’s phrased in terms of what you want to understand at a high level and should not contain references to specific ways to measure it.
- SIGNAL is how you might know that you’ve achieved the end result. Signals are things we would like to measure, but they might not be measurable themselves.
- METRIC is a proxy for a signal. It is the thing that we can actually measure. It might not be the ideal measurement, but it is something that we believe is close enough.
Developer Productivity
Although the GSM framework is a useful tool to discuss metrics, it was challenging to define our GOALs. In order to define the GOALs clearly, we needed to define Developer Productivity because our teams’ primary customers are internal developers. Our goal is to improve Developer Productivity so that they can focus on implementing new features for the end-users.
Productivity is commonly defined as a ratio between the outputs produced by a company and the inputs used in its production process. The inputs are employee workloads. The outputs are our service values measured by GMV, customer satisfaction, and so on.
In the software development context, the inputs are developer workloads, which are the number of developers and development time, and other costs such as the cost of third-party tools. To increase the scope of our business, we need to increase the size of our engineering organization. Therefore, the inputs are not the number of developers, but development time. On the other hand, the outputs are the quantity and quality of releases. The release quantity means new features, bug fixes, etc. The ratio between the release quantity and the developer time is speed. Also, development systems don’t create software, developers do. Taking care of development experience can be imperative for productivity. Therefore, we define developer productivity as a ratio between “speed, quality, developer experience”, and “cost”
Metrics
In this section, I will explain the high-level metrics of each element in developer productivity.
Speed/Quality
GOAL
Developers automatically catch problematic changes as quickly as possible and get valuable feedback from customers.
SIGNAL/METRIC
| Category | SIGNAL | METRIC |
|---|---|---|
| Continuous Integration | Automated builds and tests are executed successfully and frequently | Build Time |
| Build Failure Rate | ||
| Test Time | ||
| Test Failure Rate | ||
| Number of CI executions | ||
| Broken builds and tests are fixed immediately | The time it takes between the build/test breaking and having it fixed | |
| Continuous Testing | More bugs are found in earlier test phases | Bugs found in testing (Number of bugs found in testing and in production) |
| Test Category Portfolio in Test Pyramid. (e.g. Small Test: 80%, Middle Test: 15%, Large Test: 5%) | ||
| Add automated test cases for the bugs found during manual testing and production | Percentage of test cases covered in automated test | |
| Test Coverage (The percentage of source code tested in automation test) | ||
| Test failures always indicate a real defect in the products | The quantity of automated test failures that represent a real defect and the quality that was poorly coded | |
| Primary authors and maintainers of acceptance tests are developers | Percentage of acceptance tests written by developers, testers, and others | |
| Continuous Deployment | Developers deploy the products as quickly as possible | Number of manual steps in a deployment process |
| Deploy Time | ||
| Deploy Failure Rate | ||
| DDD (Deployed per Day per Developers) | ||
| Developers revert the product as quickly as possible when issues occur | Number of manual steps in a revert process | |
| Revert Time | ||
| Revert Failure Rate | ||
| Infrastructure | Developers use CI/CD platform whenever they want | CI/CD platform SLI/SLO |
| Security | Compliance with software supply chain best practices | SLSA Security Levels |
Developer Experience
GOAL
Developers see the benefit of the platform and have positive feelings about them.
SIGNAL/METRIC
| SIGNAL | METRIC |
|---|---|
| CI/CD platform is widely used across the company | Number of developers who are using CI/CD platform |
| Developers perceive the CI/CD platform as being an overall positive experience | Customer Satisfaction Survey: Percentage of developers reporting that their experience with the CI/CD platform is positive overall |
| Developers have positive interactions with the CI/CD platform support | Number of support requests related to the CI/CD platform |
| Percentage of support requests that received a response on the same day they were reported |
Cost
GOAL
Developers optimize costs regularly.
SIGNAL/METRIC
| SIGNAL | METRIC |
|---|---|
| Developers analyze what costs can be optimized in CI/CD platform | Total Cost of External Resources |
| Total Cost of Internal Services | |
| Total Cost of Platform Developers |
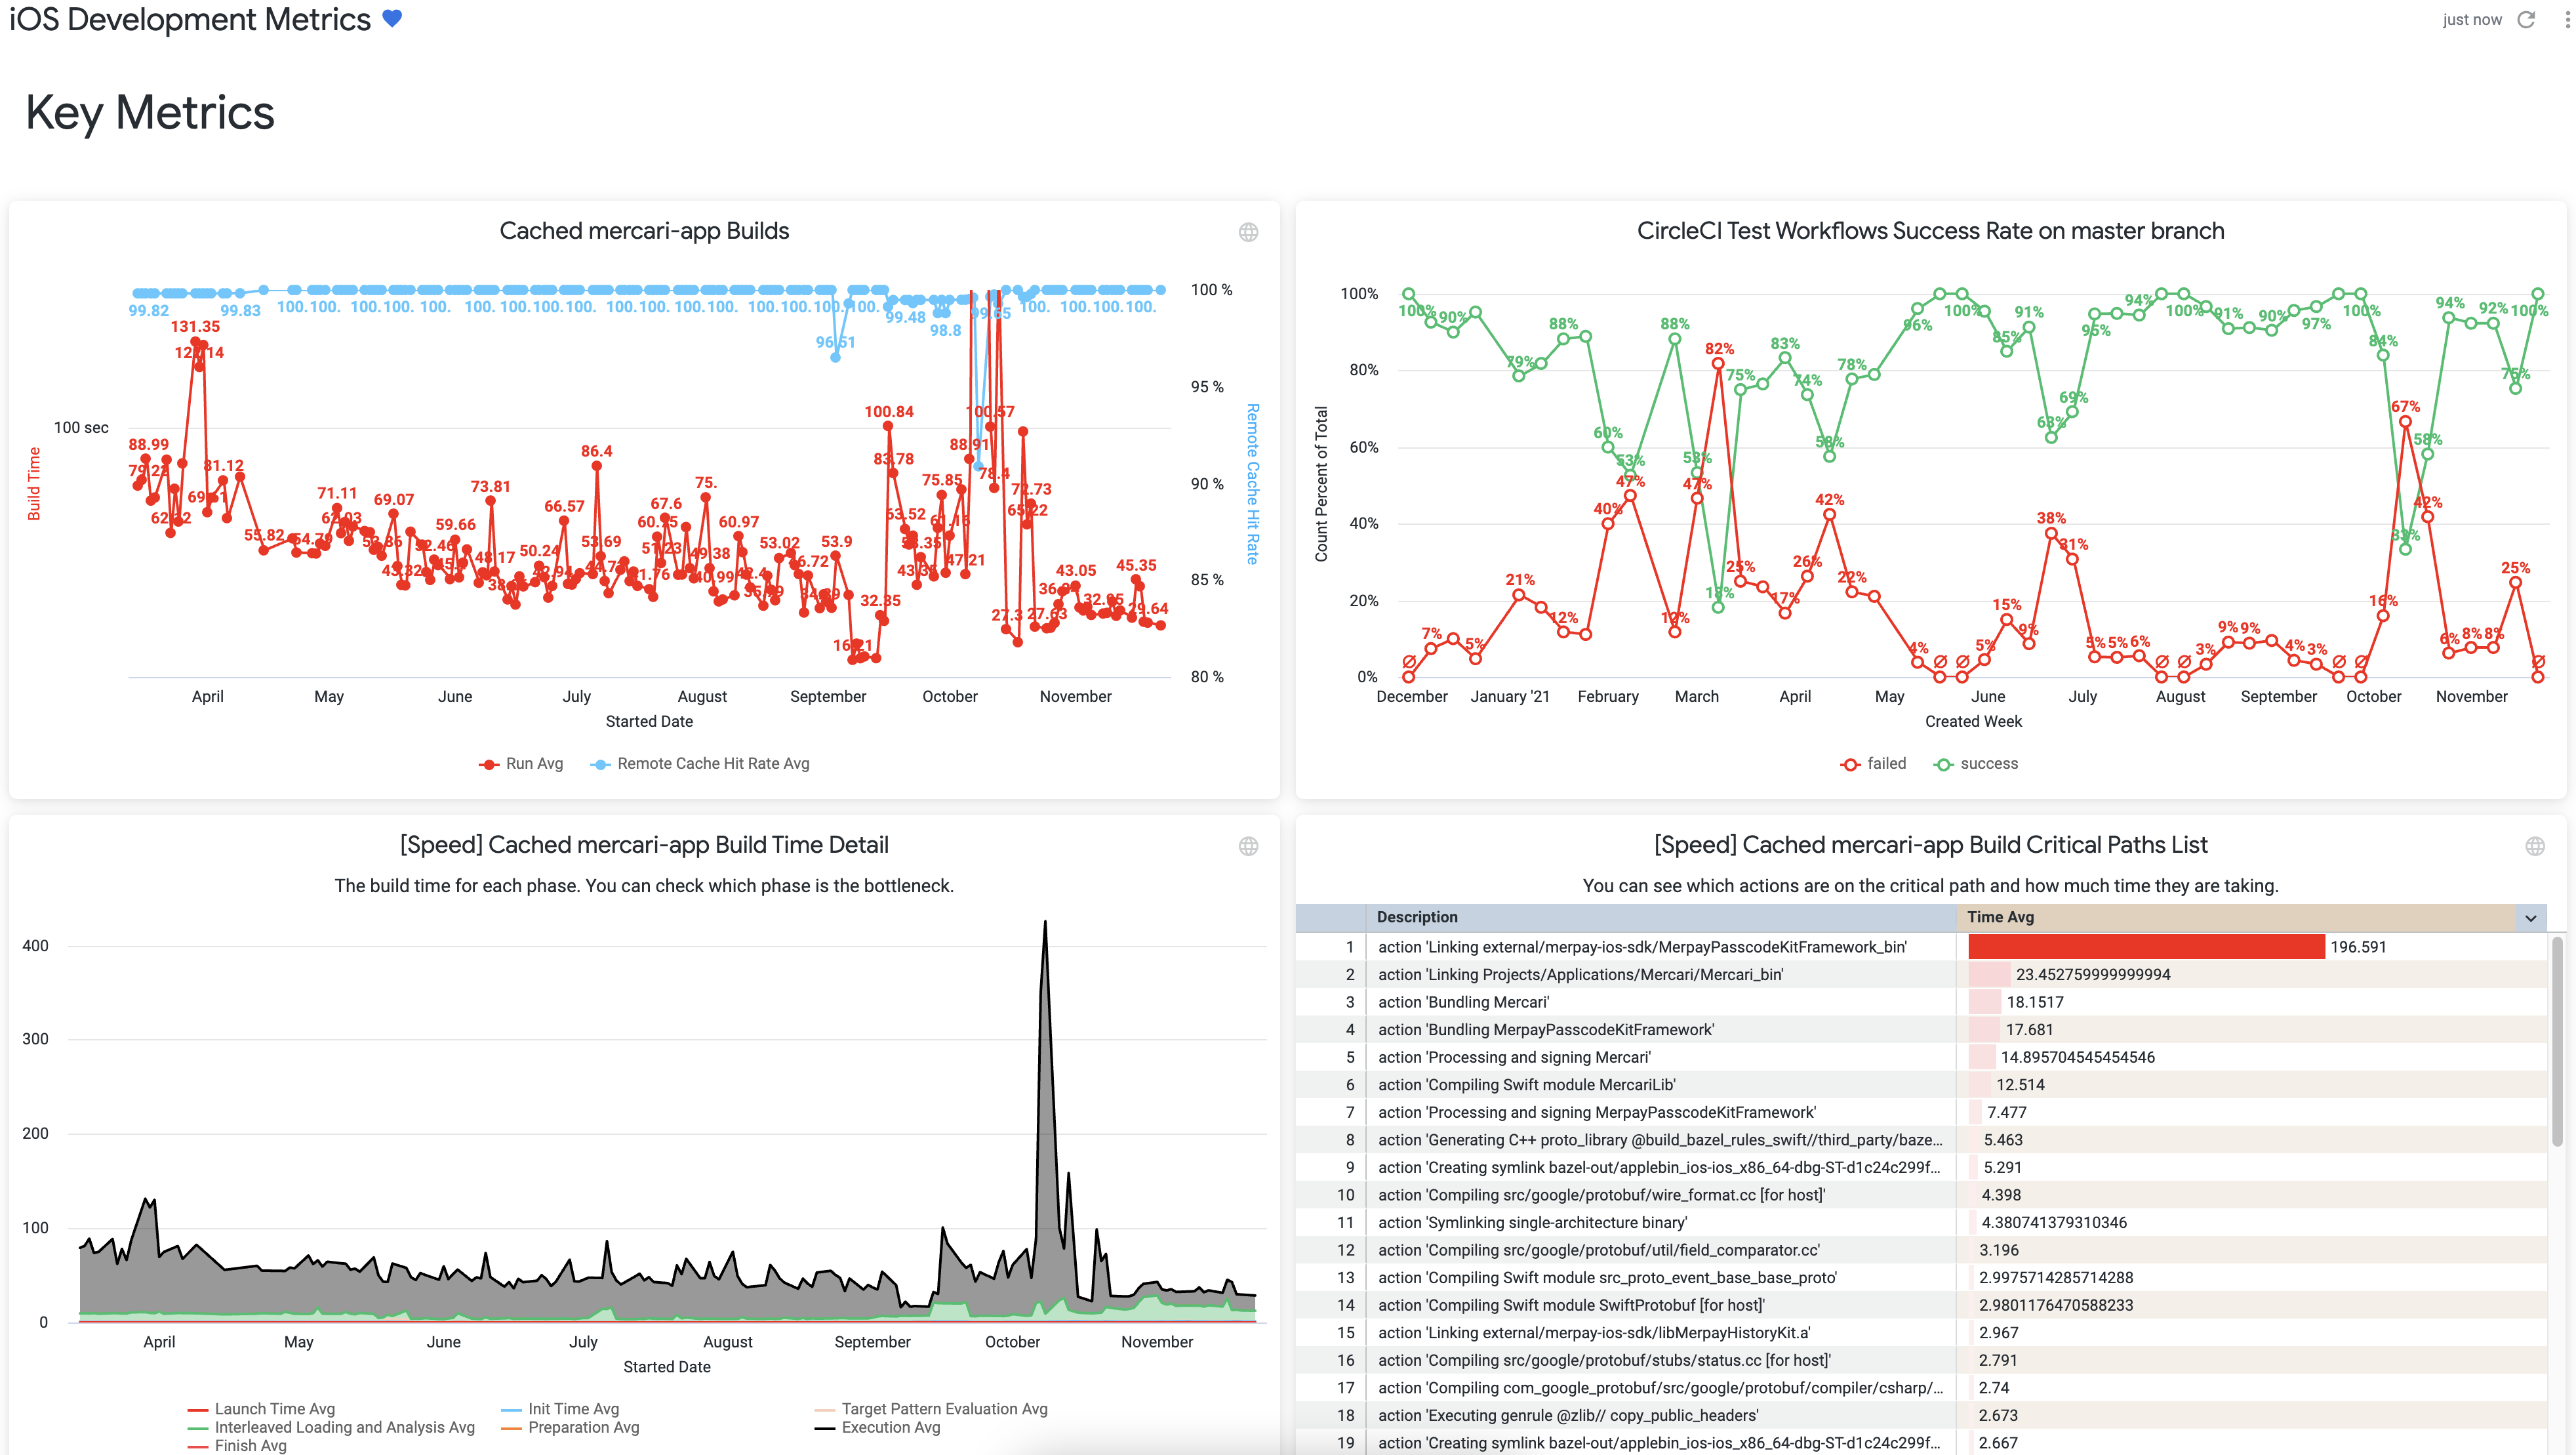
We started developing some dashboards to keep track of them as below.
Conclusion
In this article, we discussed the importance of CI/CD metrics using the GSM framework. Given these high-level metrics, we are able to give developers a productive development experience through CI/CD.
Mercari is looking for engineers. The platform described above has not been fully actualized yet, but if you would like to work with us, in a company that aims to create such a platform, please apply for a position that interests you!
- Engineering Manager, Platform Group
- Software Engineer, Platform Group
- Software Engineer, Tool and Infrastructure
Tomorrow’s article will be by Darren. Look forward to it!