@Vishal Banthia, Engineering Manager, Platform Infra Team
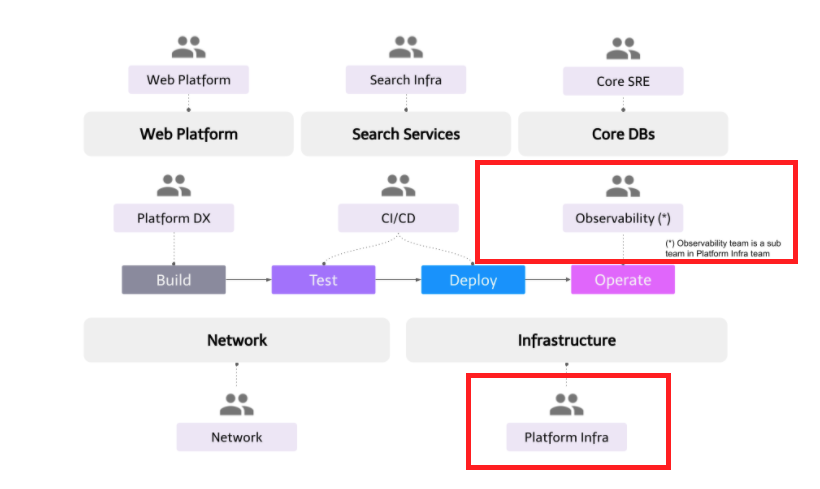
The Platform Infra team falls under the Developer Productivity Engineering Camp with a major focus on two domains – Cloud Infrastructure and Observability. In this blog post, I will introduce the Platform Infra team’s mission, key responsibilities, and future initiatives.
Mission and key goals
The Platform Infra team shares the camp mission of:
- Providing Internal Developer Platform (IDP) consisting of tools and infrastructure to enable developers to build, test, deploy and operate backend services in a secure, reliable, and scalable manner.
- Provide state-of-the-art developer experience where teams can take full end-to-end service ownership without any additional overheads.
To realize this mission, the Platform Infra team has the following goals:
- Provide tools and services to manage cloud infrastructure securely with declarative configurations
- Provide scalable infrastructure to run container workloads reliably
- Provide necessary tools to operate and monitor production services
- Provide software development statistics in time series data to enable developers and management to make data-driven decisions
Key responsibilities
Infrastructure as code
The Platform Infra team provides an in-house Terraform Cloud alike service where different teams can manage their infrastructure in Declarative Configurations securely. All terraform configurations are stored in a centralized GitHub monorepo where each microservice has its dedicated folder. As of writing this post, this service manages 1000+ terraform states and executes 300+ terraform-apply jobs a day. Some key features are:
- Terraform workflow (GitOps): To make new infrastructural changes, developers write a pull request and can review
terraform planresults in the pull request comment. Once the pull request is approved by the CodeOwner (microservice owner), developers can merge them, andterraform applywill be executed remotely. - Sandbox environment: Each terraform execution runs in a sandbox environment where it only has access to credentials specific to that folder (or microservices). This ensures there are no cross-microservice credential leak issues. Detailed implementation will be explained in a follow-up post by @dtan4.
- Terraform module support: Different teams can manage their terraform module within the monorepo. It supports module release and version management. For example, the Platform Developer Experience team provides
microservices-starter-kitandteam-kitmodules to bootstrap a new microservice and a developer team. These modules create resources such as the GCP project, GKE namespace, Spinnaker pipeline, Network Policies, GitHub team, PagerDuty schedule, etc. - Guardrails and lint: We use Conftest to write policies. Using this, we can create an allowlist and blocklist of microservices to limit what resources they can use and whatnot. We also have various bash-based lint functions which ensure coding and naming conventions within the monorepo.
Kubernetes cluster-admin
We follow the multi-tenancy cluster pattern and have 1 GKE cluster in each environment – development, and production. Microservice is considered as a “tenant” unit and we create a dedicated namespace for each microservice. Microservice owner team gets namespace ownership. As of writing this post, we have 300+ microservices running in the production environment. The Platform Infra team is the main owner and administrator of these clusters. It is their responsibility to ensure cluster reliability and scalability. Some key responsibilities are:
- Cluster upgrade: Instead of using GKE auto-upgrade feature, we manually schedule our cluster upgrade and make sure that all tenants have made necessary changes for backward incompatible upgrades. We also upgrade our development cluster first and observe for a week before upgrading the production.
- Gatekeeping: In a multi-tenant Kubernetes cluster, setting up all necessary guardrails is very important to ensure inter-tenant security. We use OPA Gatekeeper for this and our policies are explained in this blog post.
- Reliability: We use Datadog to monitor cluster health. Our GKE monitoring strategies are explained thoroughly in this presentation.
- Resource optimization: Ensuring cost efficiency is one of our key responsibilities and we try to minimize unscheduled resources (cluster capacity – requested resources) by optimizing node-pool machine specifications and other tunings. We are also doing a PoC to introduce the descheduler to optimize cluster downscaling. We also provide guidelines to developers to optimize their resources by tuning HPA and resource requests in deployment.
- System components: We have many other system components such as Sysdig, custom Fluent Bit, Datadog, Cert-manager, HashiCorp Vault, Velero, Telepresence, etc. Component maintenance and ensuring their reliability also falls under the Platform Infra team scope.
Microservices observability
Mercari uses Datadog for most of the Observability requirements – metrics, logging, and tracing. As a platform, our key responsibilities are:
- Datadog agent maintenance: Agents are installed on each node as a daemonset. Ensuring reliability and performance tuning is one of the main tasks. We also configure daemonset per node-pool as performance varies a lot based on node-pool machine specs.
- Datadog as Code: Currently most dashboards and monitors are created manually from UI and this is a big problem as we are losing consistency across our dashboards. We are working on an abstraction framework based on CUE which lets developers manage their dashboards and monitors with minimum code. In a follow-up post, @harpratap will discuss this framework and CUE performance.
- Cost Control: Cost control could be a big pain in Datadog especially when hundreds of developers are using it directly. Some simple configuration mistakes can lead to tens of thousands of extra spendings in logging and custom metrics. We learned it the hard way! We started creating custom metrics for datadog usage itself and use them for cost control monitoring
Datadog logging is used only for real-time troubleshooting as the log retention period is 7 days. For long-term log storage, we use GCP BigQuery. We use a custom Fluent Bit daemonset to send logs to GCP logging API where we further dispatch them to BigQuery using the log sink feature.
Software development statistics
This is fairly a new initiative we started. Internally we call it devstats. The basic idea with this project is that to make data-driven decisions, we first need data. The goal of this project is to provide all development activities related data in time series format in a relational database so that devstats users can get answers to questions like:
- What is the DDD (Deploy per Developer per Day from Accelerate) for a service, team, or camp and its trend over time?
- How many services are using network policy?
- Which camp/team has the highest active microservices and developers ratio?
- What is the compute and observability cost per service/team/camp?
Once management can gain this level of visibility they can make better organizational and technical decisions based on a data-driven approach.
Implementation-wise, devstats has various data collectors which periodically collect data from different sources such as microservice-starter-kit, team-kit, Spinnaker, Terraform-ci, Kubernetes-ci, PagerDuty, GitHub, etc and dump into BigQuery tables. Then, devstats’ aggregators aggregate all these data periodically(currently once a day), map them with microservice service_id and store them in a “service_stats” table. Each row in this table contains complete information about a service for a particular date such as owner_list, team, camp, incidents, deployments, etc. Using this devstats users can analyze trends over time.
Most devstats users are only required to use the “service_stats” table for most of the analysis. Users can also make their custom dashboards using DataStudio or other similar services.
Future Initiatives
Our backlog is full of new things we want to do. Other than devstats, I will share two major new initiatives which I am very excited about.
Multi-cluster
As shared earlier, we are using a single GKE cluster in the production environment. This has been working well for the last 4 years but we would like to be prepared before we meet any hard scalability limit. Our current multi-cluster priorities are:
- Same region homogeneous clusters: By homogeneous, it means all clusters are identical and run the same workloads. This will improve cluster operation reliability and overall scalability. Platform teams will be able to do a canary release for cluster-wide components such as Istio. Cluster migration would become much easier. Our last migration took 6 months to complete!
- Same region heterogeneous clusters: By heterogeneous, it means clusters will be running different workloads and namespaces will be different. These clusters are useful for services where strict isolation is required for security and compliance reasons
- Multi-region homogeneous clusters: This is mainly to support disaster recovery scenarios. For us, Geographical latency is not a big issue as most of our customers are in Japan
GKE has recently introduced some new features such as Multi cluster ingress and Multi cluster services and leveraging these we want to meet our multi-cluster requirements. Our main goal with this project is to keep multi-cluster details hidden from developers and they should not need to duplicate any of their work just to support the multi-cluster environment. Platform tooling should be able to handle all of that.
This will be a big project requiring collaboration from different teams such as Network, CI/CD, Platform DX and SREs. Each team will be required to enhance their toolings to support the multi-cluster environment.
Observability v2.0
As you may have realized, we heavily relied on Datadog for all our observability requirements. This has indeed given us a good speed in the beginning but over time we started observing some core issues as microservices are using Datadog directly and are tightly coupled. We want to introduce a control layer between microservice and backend tools (Datadog, Prometheus, etc) such as OpenTelemetry so that as a platform we have better control over the usage and can provide more backend options to our developers which would be easily configurable and changeable through our provided toolings.
We are Hiring!
What used to be a small Platform team became a Platform Group and now a whole camp (Division) of almost 50+ engineers. We are growing rapidly and making a positive impact in Mercari and all its subsidiaries. Our core mission will always remain the same which is to accelerate developers’ productivity through workflow automation. If this is something that interests you and would like to know more about us, feel free to drop me a message over Twitter or LinkedIn. We sponsor work visas and Japanese language is not a requirement for our team.
You can also apply directly from our career site: