
The eighth day’s post of Mercari Advent Calendar 2020 is brought to you by Kaili Zhu from the Mercari ML Listing team.
Introduction
Here at Mercari, we subscribe to the philosophy of the circular economy. Specifically, we hope for a more sustainable future by helping to shift society from mass production and mass consumption to circular production and consumption models. In essence, we want to encourage people to buy items with the intention of selling them when they are no longer needed. In this way, many others may make good use of those items.
To achieve our goals, it is important to understand our marketplace and users. What kinds of things do people sell? What kinds of things do they actively seek out? What is the interplay between buying and selling? To this end, we have found that analyzing hashtag usage patterns can provide insights. Since its creation, Mercari has accumulated millions of hashtags in its listings’ descriptions, with more users using hashtags to sell their goods.
To better understand our users and marketplace, we did a community analysis [1] on 1,000 recent popular hashtags and uncovered some interesting seller/buyer patterns. In particular, we wanted to answer the following questions:
- Is the hashtag listed/searched in a democratic way by many users? Or is it exclusive to a few users?
- How many seller/buyer user IDs overlap in the community of the hashtag?
- How much will the seller/buyer community change between months?
Democratic VS. Exclusive
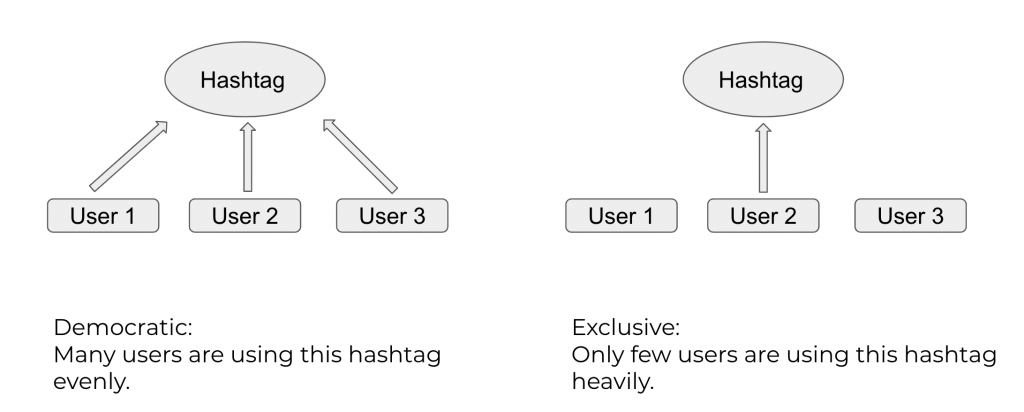
For any hashtag, if many users are using it evenly then we can say that it has a democratic usage, otherwise, it is considered exclusive if usage is skewed towards a subset of users.
Suppose we have a hashtag H and two sellers Seller_1 and Seller_2 with the following two scenarios:
Scenario_1:
- Seller_1 sold 3 listings with hashtag H.
- Seller_2 sold 10 listings with hashtag H.
Scenario_2:
- Seller_1 sold 3 listings with hashtag H.
- Seller_2 sold 3 listings with hashtag H.
To calculate entropy for how democratic a hashtag is, let’s walk through an example. If we consider Scenario_1, we can write a vector representing how many times sellers sold listings with hashtag H: [Seller_1: 3, Seller_2: 10].
Normalizing the vector to sum to 1, we get [Seller_1: 3/13, Seller_2: 10/13].
Similarly, for Scenario_2, we get [Seller_1: 3/6, Seller_2: 3/6].
Then entropy([3/13, 10/13]) ≈ 0.78 and entropy([3/6, 3/6]) = 1.0.
So a higher entropy score indicates the hashtag was used in a more democratic manner while a lower entropy score indicates more exclusive use.
Results:
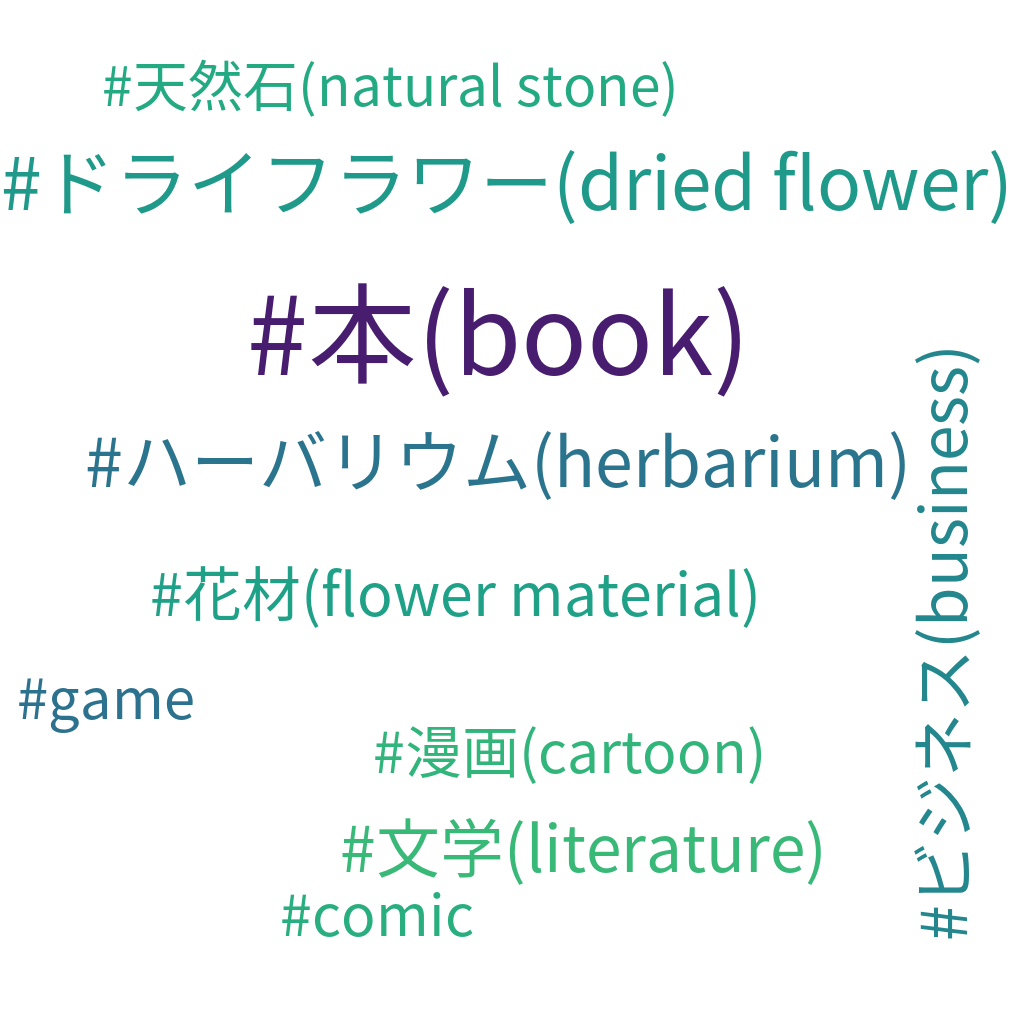
Here are some hashtags used democratically by sellers (some brand-specific hashtags have been removed):

These results indicate themes of items that are widely sold by people in general.
We also, show some hashtags searched democratically by buyers (some brand-specific hashtags have been removed):

These results indicate themes of items widely sought after by people in general.
Seller/Buyer IDs Overlap
The previous results bring up another question. With some themes of items being widely sold and sought after by people, are there overlaps between sellers and buyers on the same hashtags? In other words, we also would like to know how many seller/buyer user IDs overlap.

We illustrate this next question with an example. In the above figure, we have four sellers A, B, C, and D, and three buyers A, B, and E. A and B are both in the seller and the buyer groups, so the count of the overlapped user IDs is 2. Knowing how many of the same people might buy and sell items based on the same theme is useful. However, we would also like to compare such numbers between different hashtags. Since each hashtag has a different count of the overlapped user IDs, we transformed the absolute overlap counts to percentages for comparison. Specifically, we considered the overlap percentage of the sellers and of buyers, as shown in the figure.
A high percentage for sellers means that the sellers are likely to be buyers and vice versa. This phenomenon is good for Mercari’s philosophy of a circular economy, where items no longer needed by one person can still continually benefit others in society.
Results:
Here are some hashtags with a high overlap percentage of sellers (some brand-specific hashtags have been removed):
Also, hashtags with a high overlap percentage of buyers (some brand-specific hashtags have been removed):

Seller/Buyer Community Change
Up to this point, we have only considered communities within some period of time. It is also important to think about how such communities would change over time. Thus the last question we decided to answer is how much the seller/buyer communities change between months for each hashtag. To measure such changes between months, we use the Symmetric KL Divergence (SymKL).
Let’s walk through an example. Suppose there are three sellers A, B, and C, and we have the sold listing counts of each seller in September and October in the following two scenarios:
Scenario_1:
A: [Sept: 1, Oct: 1], B: [Sept: 2, Oct: 2], C: [Sept: 3, Oct: 3]
Scenario_2:
A: [Sept: 1, Oct: 1], B: [Sept: 2, Oct: 2], C: [Sept: 3, Oct: 13]
Then we can see that in Scenario_1, where the counts did not change at all, the seller community is more stable than that of Scenario_2, where seller C sold much more in October.
Computing the Symmetric KL Divergence for each scenario gives us:
Scenario_1: SymKL([1/6, 2/6, 3/6], [1/6, 2/6, 3/6]) = 0
Scenario_2: SymKL([1/6, 2/6, 3/6], [1/16, 2/16, 13/16]) ≈ 0.21
(The distributions have been normalized to sum to 1.)
A low SymKL score means that the seller community does not change much between months.
Results:
Here are some hashtags with a high SymKL seller scores (some brand-specific hashtags have been removed):

Hashtags with low SymKL seller scores (some brand-specific hashtags have been removed):

Hashtags with high SymKL buyer scores (some brand-specific hashtags have been removed):

Hashtags with low SymKL buyer scores (some brand-specific hashtags have been removed):

Since the recent hashtags we used were from September and October, we noticed several hashtags with strong seasonal trends, e.g., #ヒートテック (heattech), #ダウンジャケット (down jacket). It is not surprising that the seller and buyer communities of such hashtags changed a lot between the two months.
The analysis also caught some popular trends in the outside world. #鬼滅の刃全巻 (an anime series) became more popular possibly because a feature film was recently released.
Hashtags representing general concepts like #漫画 (cartoon), #本 (book), #外国映画 (foreign movie) seem to have more stable buyer communities, as they represent people’s long-term hobbies. But for specific authors, e.g., #東野圭吾, #ゲッターズ飯田, their seller communities changed quite a lot, showing the authors have short-term trends too.
Concluding Remarks
Democratic hashtags provide an indication of what kinds of items have wide appeal. Hashtags associated with high overlap percentages between seller and buyer IDs also give hints on where the “circular economy” philosophy of Mercari is actively practiced. For any hashtag, it’s good that its community maintains stability, but user changes in the market can also bring new vitality.
Using our investigations into the communities around hashtags, we hope to do our part in maintaining and encouraging the ever more widespread adoption of the circular economy philosophy. By encouraging our users to sell things they no longer need and buy when they need, we reduce waste and ensure each item’s potential value to everyone can be maximized.
Acknowledgments
I would like to thank the following colleagues for their valuable help in this article:
antonylam
cournape
akis
karolis
kamino
References
- Posch, L., Wagner, C., Singer, P., and Strohmaier, M. (2013). Meaning as Collective Use: Predicting Semantic Hashtag Categories on Twitter. Proceedings of the 22nd International Conference on World Wide Web Companion, Rio de Janeiro, Brazil.