This post of Merpay Advent Calendar 2019 is brought to you by @agro1986 from Merpay AML/CFT team.
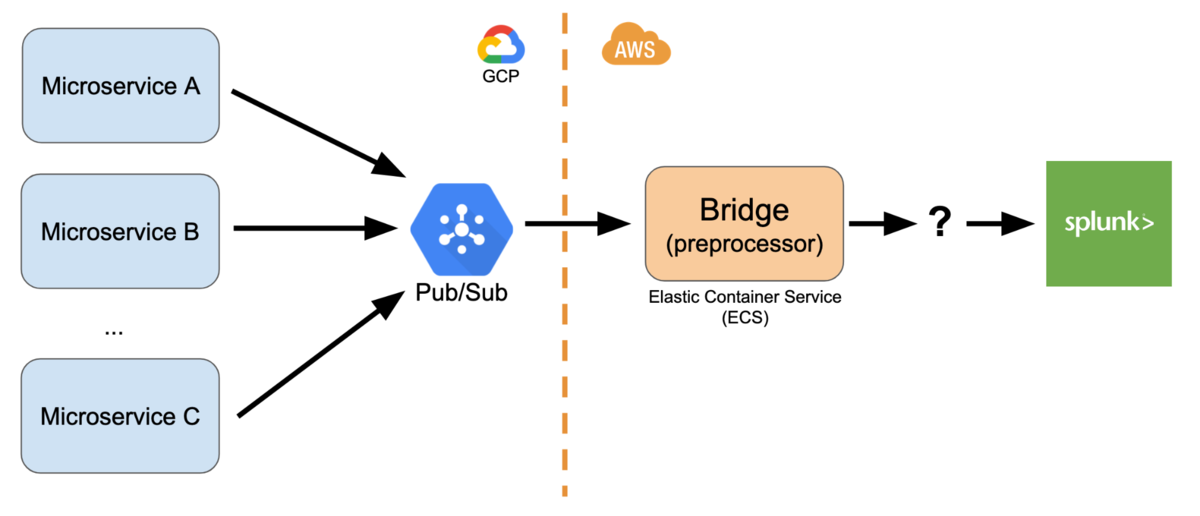
As explained in our previous articles (1 and 2), Merpay’s AML (Anti Money Laundering) system uses Splunk as its centralized database and rule engine. There are various microservices within Merpay and Mercari so there are several ways in which we obtain the data, but most of them use Google Cloud Platform (GCP) Pub/Sub:

Our bridge server subscribes to Pub/Sub and preprocesses the data for transaction monitoring purposes. This includes standardizing field names and values from differing microservices, and also enriching the data with extra information:
| Fields (before enrichment) | Fields (after enrichment) |
|---|---|
| time userId itemId price paymentMethod |
time userId itemId price paymentMethod isBankRegistrationDone isFirstPayment |
Data enrichment for an item purchase event
(illustration, not actual field names)
After preprocessing, we serialize the data to JSON and it’s ready to be sent to Splunk. But how to actually achieve that?

Design goals
There are many ways to send data to Splunk, each with their own pros and cons. Therefore to select the best one we first have to know our needs. For Merpay’s AML system, those are:
- Robustness: Even if there is a temporary network or system failure, all the data must eventually be indexed by Splunk. Data loss must be avoided even if OS or disk failure happened.
- Speed: For a timely detection of suspicious transactions, data must arrive with low latency. Initially we aimed for 5 seconds latency.
Let’s look at the alternatives to understand why we eventually chose to develop our own aggregator.
AWS Firehose
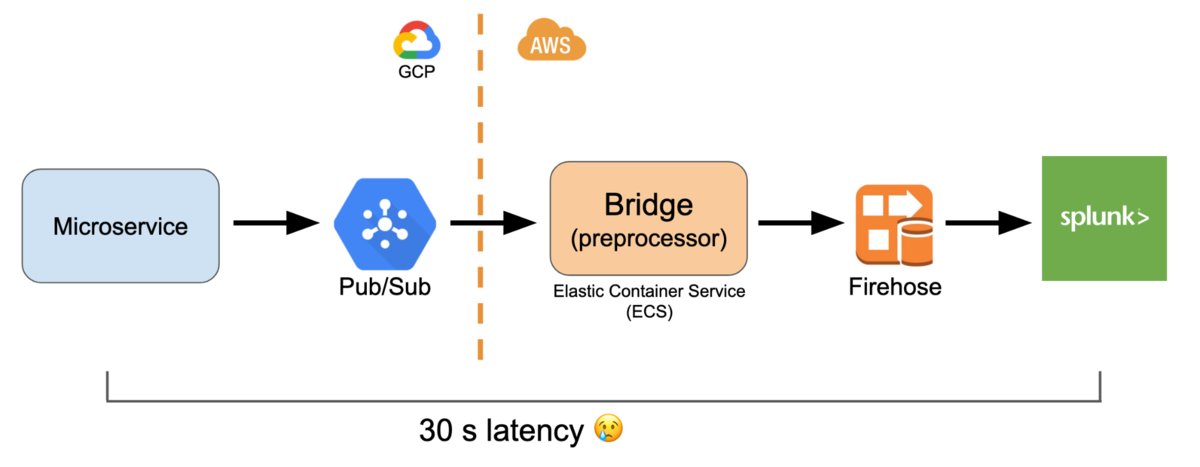
We can send data to AWS Kinesis Firehose and then configure it to forward the data to Splunk’s HTTP Event Collector. Firehose will check and guarantee that the data will arrive at Splunk, so that’s good from a robustness point of view! Because it is easy to set up and use, we actually used Firehose at first. However there are some major downsides.
First, Firehose will buffer your data before sending it to Splunk, so it will wait until 5 MB of data arrived or 60 seconds has passed. That is too slow for our needs. Here’s what the end-to-end (originating microservice to Splunk) average latency looks like.


We wanted to have latency better than 30 seconds.
(It seems that now you can set Firehose buffer as small as 1 MB, but the AWS docs still state that it is not configurable and will use 5 MB buffers for Splunk. It says “these numbers are optimal” 🤦)
Second, Firehose guarantees delivery but it might deliver your data more than once! This duplication occurs frequently enough that we have to use dedup (like DISTINCT on SQL) on our Splunk queries or else sums and other calculation will be wrong. Having to use dedup makes the query slow and memory heavy.
Other solutions
With that in mind, we researched several alternatives:
- POST directly to Splunk’s HEC: The indexing is asynchronous, so you have to send another HTTP request later to the indexer to know whether the data transfer (and replication across indexers) is successful or not. In our cluster with high replication and search factor, the HEC acknowledgement might take more than a minute. We don’t want the client side to do that kind of slow and complex state management before sending ACK back to Pub/Sub.
- NFS/persistent storage: The application can write to a persistent storage, and Splunk forwarder can be used to monitor the file and forward the data to Splunk indexer. However we use Fargate for our bridge containers and it could not mount EFS disk (even if it could, EFS is slow compared to the faster EBS)
- Splunk forwarder sidecar: Fargate task can use nonpersistent storage and a Splunk forwarder sidecar can monitor the file written to it. However, in the event of task failure or shutdown, data written to the storage but not yet sent to the indexer will be lost forever.
- Fluentd + Splunk forwarder: Send data using HTTP request to a Fluentd server, output it to a file, and then have Splunk forwarder on the same server monitor the file. The problem is that Fluentd uses buffering and when it returns HTTP 200 OK, it doesn’t guarantee that the file has already been written to disk. On system failure data which are still in memory might be lost forever. We tried various settings related to file output buffering but couldn’t get rid of it.
Custom Aggregator
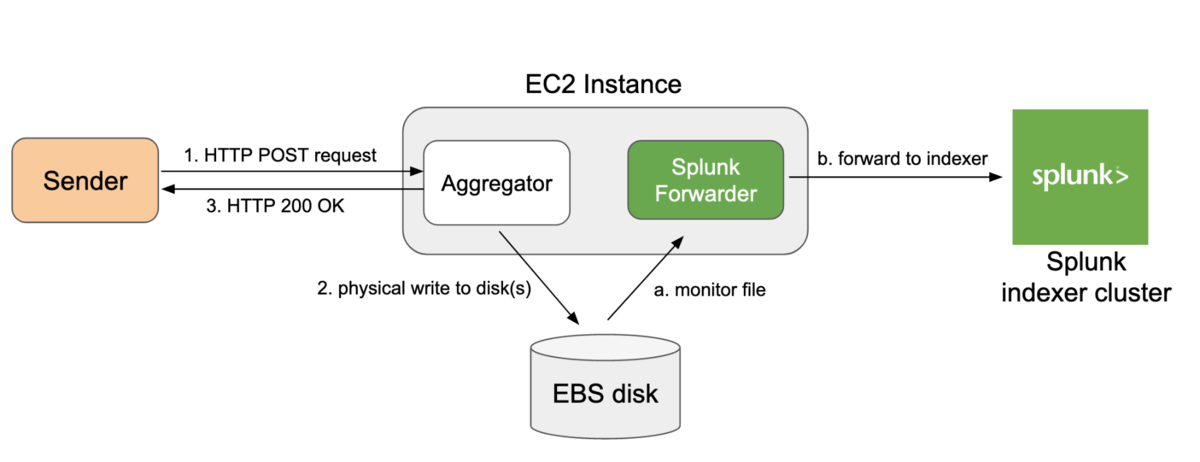
As shown above, we are concerned about loss of data in transit in the event of system failure. To solve that, we needed to create a custom aggregator for our needs, and here’s the basic system design that we came up:

The aggregator is a web server written in Go and for every sender (microservice) we will create a different file on the file system which is rotated daily. Here’s how you would create a request to send data (multiple lines is supported):
curl -X POST https://AGGREGATOR_URL/api/v1/send/SENDER_ID
-d '{"message": "hello world"}'
The most important part is we want the aggregator to return HTTP 200 OK if and only if the data has been physically written to the disk. This is achieved by calling fsync:
// requests are handled concurrently,
// so many goroutines might call this function
// with the same file descriptor at the same time
func write(file *os.File, data []byte) error {
// no need to implement locking mechanism
// os.File already implements mutex for read/write operations
_, err := file.Write(data)
if err != nil {
return err
}
// no need to implement locking mechanism
// os.File already implements mutex for sync operations
err = file.Sync()
return err
}
Calling only os.File.Write will request the Linux kernel to write data into the file, but to actually force a physical write we need to call Sync which will do system call to fsync. There are various details to keep in mind like the file system type and kernel version (see 1 and 2) because different combinations behave differently 🤷♂️.
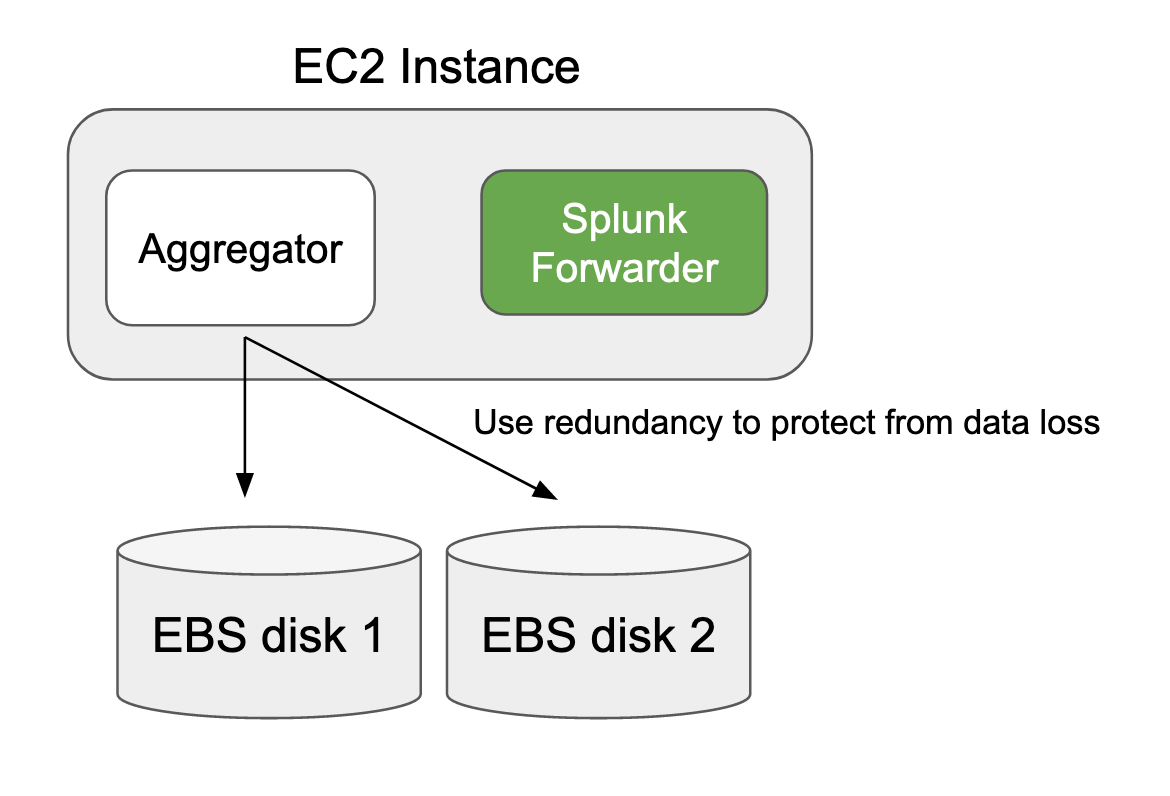
Once the file is written to disk, Splunk forwarder running on the same EC2 instance will monitor for changes and guarantees data delivery to the indexer. Therefore, data is guaranteed to be sent even if Splunk forwarder, aggregator, or event the OS itself crashes. However, to guarantee that no data loss occurs if one disk fails, we configure the aggregator to write to multiple disks and returns OK only after the data has been fsynced to all the disks. In our current configuration, we use 2 EBS each having 1,000 IOPS. The writes are parallelized so it does not incur performance hit.

Here’s our HTTP response time on our production environment with 6 load-balanced aggregators:

That’s 2 ms (millisecond, not second 😊) average time to do an fsync write to 2 disks! Load testing shows that we can scale horizontally by adding more aggregators if the number of requests become too high and it starts to affect write performance.
And finally here’s our end-to-end microservice to Splunk indexer latency:


We are able to bring the latency down from 30 seconds using Firehose to under 2 seconds using our custom aggregator! That’s including Pub/Sub overhead, GCP to AWS travel time, and data enrichment preprocessing on our bridge server. We also have strong guarantees against data loss. With this solution we can realize our vision of real time transaction monitoring for AML/fraud detection.
Conclusion
Plug-and-play cloud solutions like Firehose might be easy to set up and use, but you might run into severe limitations if you have tough requirements. In that case, it is worthwhile to spend time designing your own solution to get better results.
If you’re interested in working on these kind of challenging problems, feel free to look at our openings 😉
Tomorrow’s blog post – the 21th in the Advent Calendar will be written by @FoGhost. Please look forward to it!


