The 19th day’s post of Mercari Advent Calendar 2019 is brought to you by @panini from the US@Tokyo Android team.
As most Android engineers will know, the majority of your day is spent waiting for Android Studio to complete building your app 😇
While this is good for those of you trying to catch up on Twitter, or finish reading your book, it is not great for your work speed, and sometimes you just want to get some work done.
Here are 3 tips to help you improve your build times and get those coding fingers working!
Profiling
Ah – not so fast! Before you start trying to improve things, you first need to know what you are dealing with.
Profiling is the act of timing how long each task in your build takes. By taking a profile of your build, you can accurately see which tasks are taking the longest, and if you have any tasks that are taking longer than you expect them to take. Once you find these outliers, you then know where you should look to try and optimize your build speed – this is somewhere that you definitely don’t want to try and optimize early, as trying to optimize a task that is only taking a few milliseconds will not give us many gains, compared with one that is taking a few minutes.
For profiling, there are a few different ways you can do this, for now I will list 3:
Using Gradle
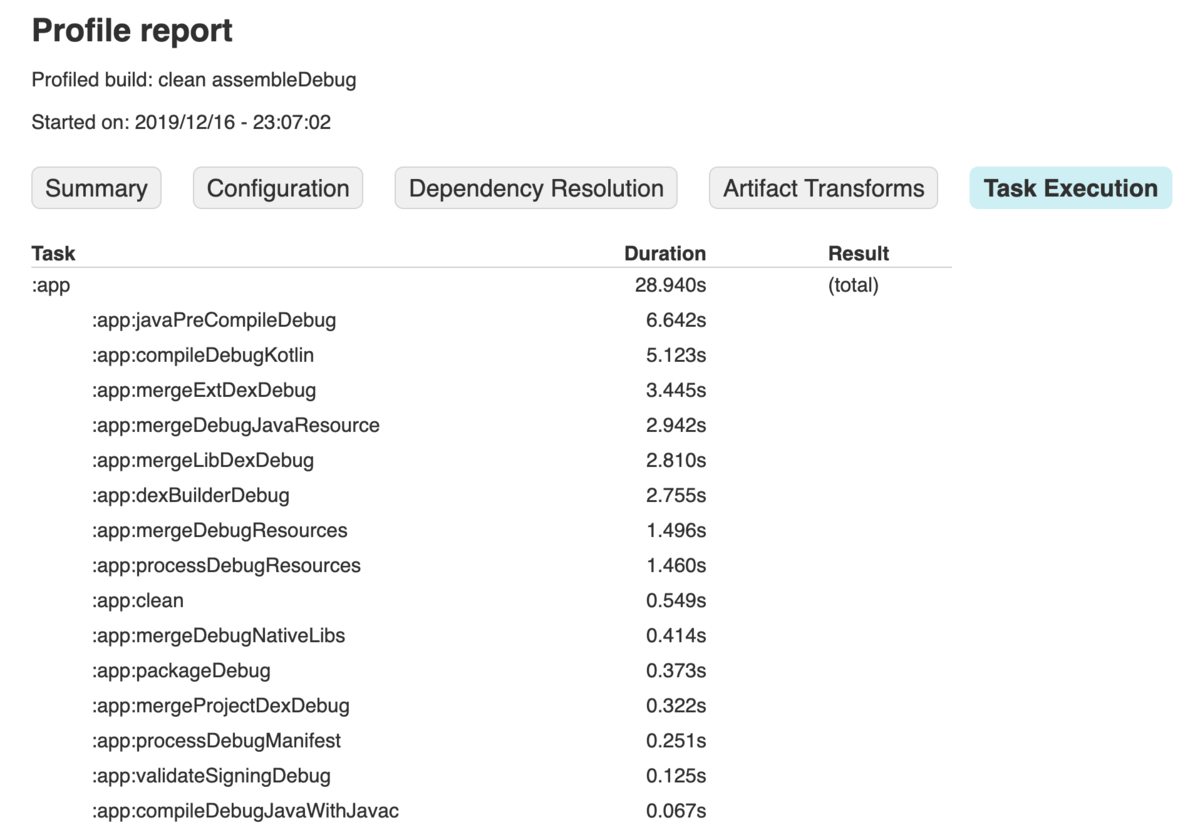
The first way I would like to introduce is using the built in gradle profiler. If you are running Gradle 4.3+, then the gradle build scan plugin should be automatically added to your project, so profiling your build is as simple as calling the following command:
$ ./gradlew clean assembleDebug --profile
Here, you can replace assembleDebug with whichever build type you want to profile.
After the build finishes, there should be a link to a page with the results from the profile! It should look something like this

Gradle also offers a --scan option, which will create a more in depth profile, and upload this to scans.gradle.com so that you can view it there. You can use this option with the following command:
$ ./gradlew clean assembleDebug --scan
You will be asked to accept the terms of service before uploading the profiling report, and then after a link will be generated which should take you to your build profile.
Note While I was able to get this to work in the past, currently each link I generate returns a 404 not found when I click it. If I find the cause for this, I will update this blog.
Using Talaiot
Next, let’s look at Talaiot.
Talaiot is a very powerful tool, which can be used to track the build times of both you and your team (provided you set it up on a server that is accessible by the team).
The setup for Talaiot is out of scope for this blog, however if you have a look at the wiki page on Github, you should be able to get set up soon enough.
Talaiot will profile all builds by default, so you don’t need to call any specific command in order to use it.
Using Android Studio 4.0
As announced at Android Dev Summit 2019, Google has been spending time looking at ways to improve build speed within Gradle. And one of the ways they’re working to achieve this, is by building a profiler right into Android Studio. While still only available in the Android Studio 4.0 (currently at Canary 6 at time of writing), this tool is looking to be very useful for when you want to quickly profile your build. You can read the announcement blog post here, which has steps on how to enable the build speed window, after which you should see a screen showing you a breakdown of the tasks and time taken in your build.

Simple build speed tricks
Now that you have finished the most important task of profiling your build, next here is a list of a couple of easy wins you can make to improve your build speed.
Incremental Annotation Processing
Most Android apps these days will be using annotation processing for generating code – be it Dagger 2, Epoxy or Room, these libraries help us by abstracting away the boilerplate code behind an annotation & generated code.
One simple way to gain back some build speed is to enable incremental annotation processing. If you are using Kotlin, make sure you are using at least version 1.3.31, and then add the following to your project’s gradle.properties
kapt.incremental.apt=true
Next, we need to update our dependencies to versions that support incremental annotation processing. You should be able to see this in the release logs for your dependencies, but for the more popular libraries, use versions at or later than:
- Dagger 2 ->
2.24 - Glide ->
4.9.0 - Room ->
2.2.0(need to enable via a compiler option) - PermissionsDispatcher ->
4.5.0
Disable Firebase Performance Monitoring
Firebase Performance Monitoring is a great way to see how your app is performing in the real world, and can lead to insights into pain points for your customers, however due to the way it hooks into your app, you will suffer a build speed decrease when using it.
Because we’re unlikely to use Monitoring for debug apps, we can disable monitoring for this flavor and gain back some precious build speed! If you add the following to the android build types block in your apps build.gradle file, you can disable monitoring for just the debug flavor:
android {
buildTypes {
debug {
FirebasePerformance {
instrumentationEnabled false
}
}
}
}
Closing
These were just a few ways that you can improve your build speed, but the most important thing you can do is to profile your build to make sure that any changes you are making are actually having an effect.
Tomorrow’s blog – the 20th in the Advent Calendar will be written by @lain21. Please look forward to it! 😸