Elasticsearch and ECK
At Mercari, we use ECK (https://github.com/elastic/cloud-on-k8s) to manage Elasticsearch on Kubernetes. ECK is an Elasticsearch Custom Resource with its own controller. When you create the following resources, the corresponding StatefulSet, Service, ConfigMap and Secret resources are automatically created:
apiVersion: elasticsearch.k8s.elastic.co/v1
kind: Elasticsearch
metadata:
  name: example
spec:
  version: 8.8.1
  nodeSets:
  - name: coordinating
    count: 2
  - name: master
    count: 3
  - name: data
    count: 6
From this definition, 3 StatefulSets (coordinating, master, and data) will be created.
We wanted to scale these StatefulSets using the Horizontal Pod Autoscaler (HPA), but we ran into the following challenges:
-
The Elasticsearch resources themselves cannot be targeted by HPA because the scale sub-resource (described later on) is not defined. This means we cannot determine which of the multiple nodeSets should be scaled out or in.
-
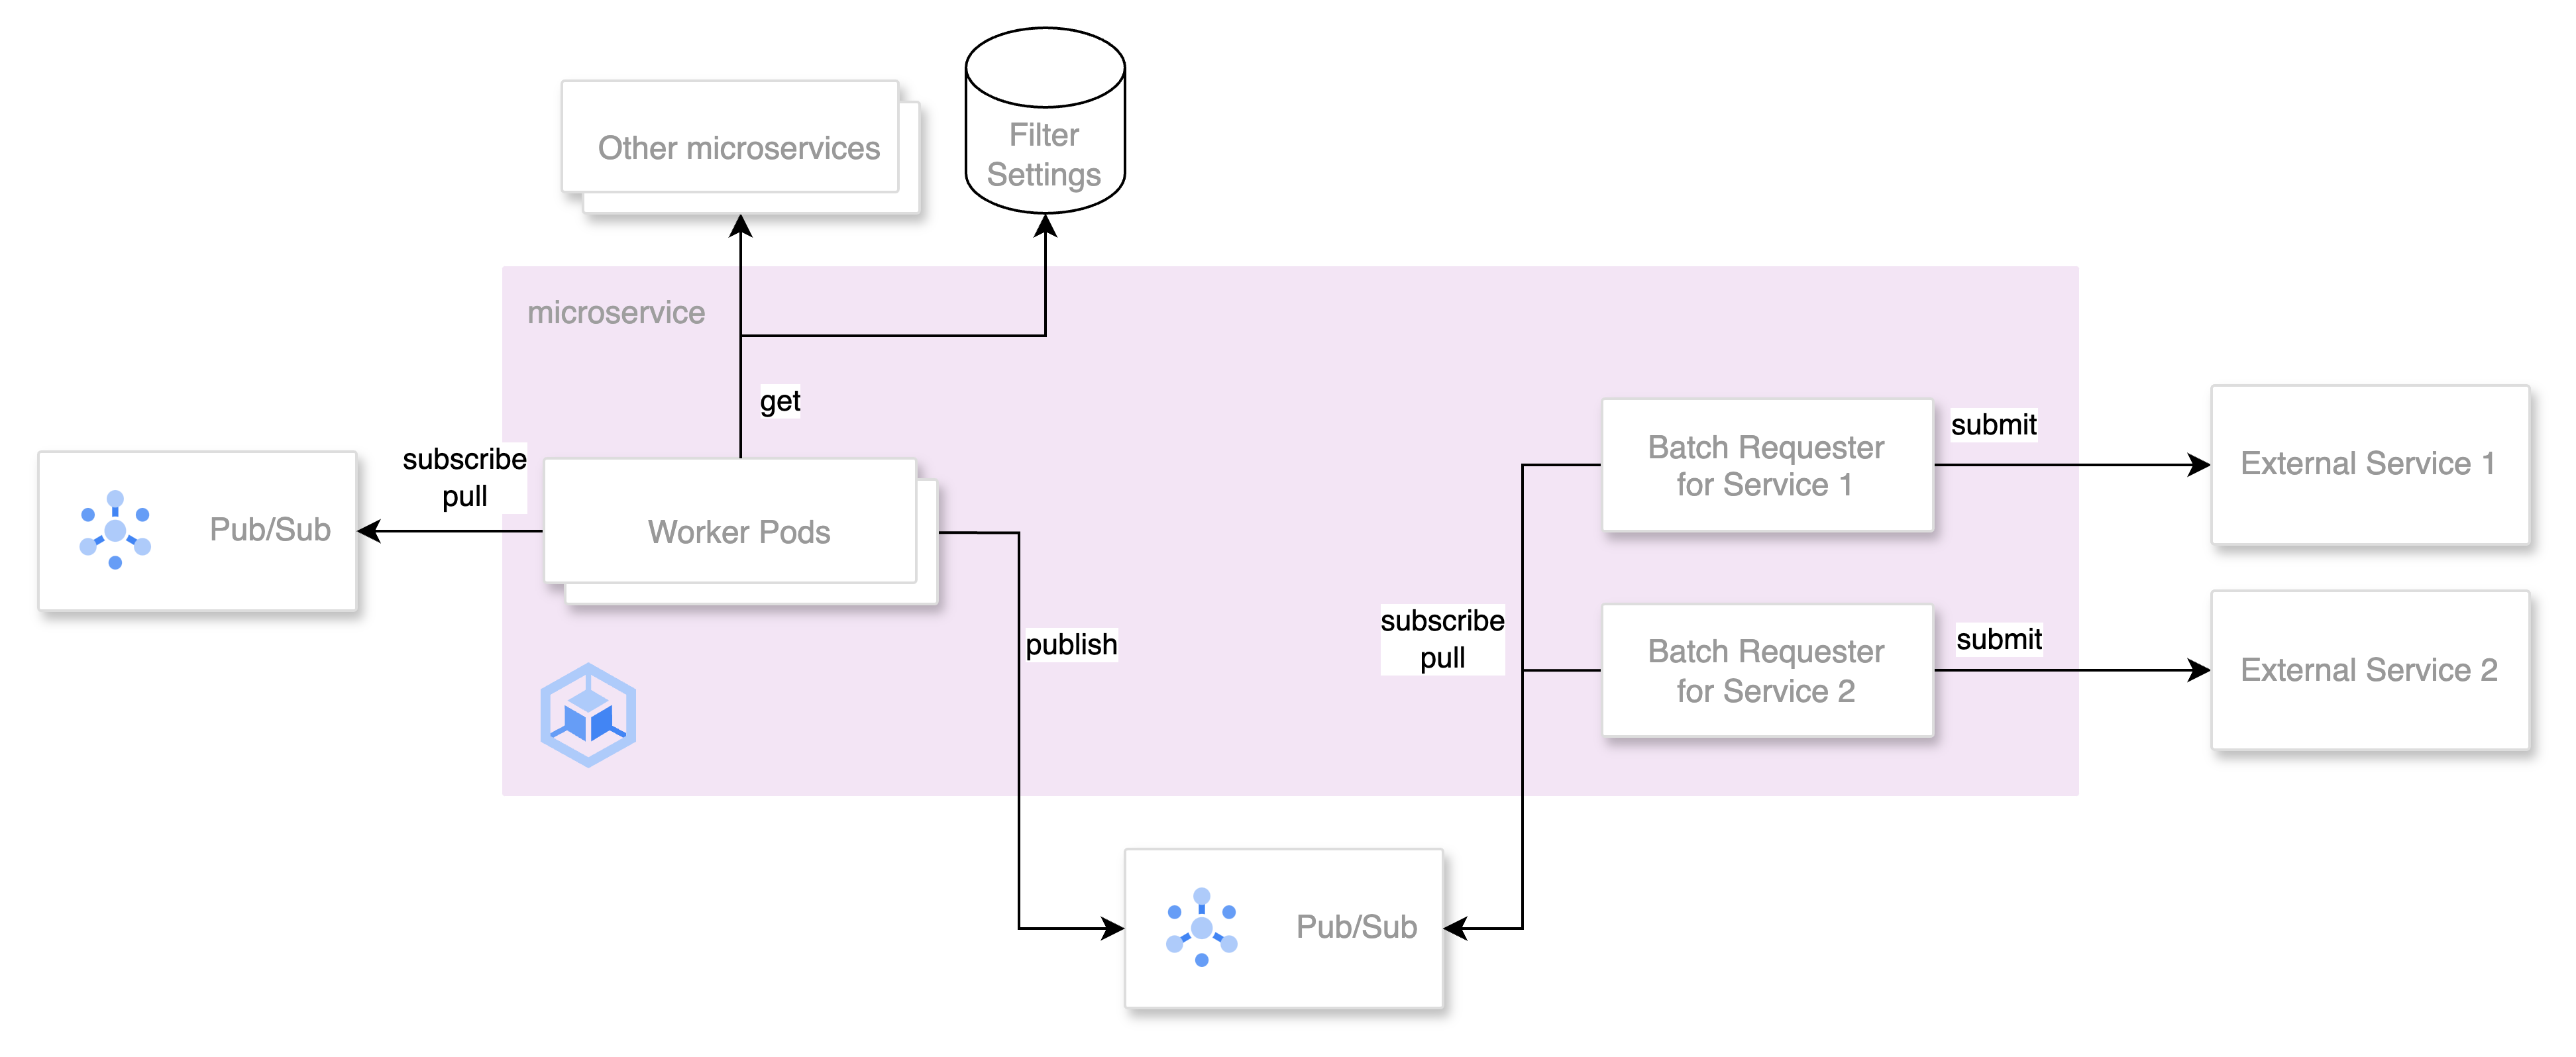
Scaling Elasticsearch does not stop at only increasing or decreasing the number of Pods, but it also requires adjusting the replica count of indices allocated to each Pod. In other words, the scaling unit becomes ${number of shards in an index} / ${number of shards per Pod}. In the example diagram below, it would be (3 / 1) = 3. On the other hand, with HPA, it is possible to specify any value between minReplicas and maxReplicas.
 Elasticsearch has option
 auto_expand_replicasthat adjusts the replica counts automatically. However, this makes the number of shards per Pod equal to the number of shards in the index (shard per Pod = shard per index), each Pod would end up with 3 shards. This does not fit our use case, and so we need to manually adjust the replica count ourselves. -
In addition to the previous problem, if the StatefulSet managed by Elasticsearch resources is directly targeted by HPA and the parent Elasticsearch resource is updated, the number of Pods adjusted by HPA would be overwritten by the value provided by the parent resource.
In order to solve these problems, we created a new Kubernetes Custom Resource and controller.
Custom Resource and controller
The following is an example of what the newly introduced Custom Resource looks like:
apiVersion: search.mercari.in/v1alpha1
kind: ScalableElasticsearchNodeSet
metadata:
  name: example
spec:
  clusterName: example
  count: 6
  index:
    name: index1
    shardsPerNode: 1
  nodeSetName: data
This definition corresponds to the nodeSet definition named "data" in the Elasticsearch resource we mentioned earlier. This resource does not have a direct parent-child relationship with the Elasticsearch resource but provides scalability via a scale subresource, which can be targeted by commands like kubectl scale or HPA. The definition of the Custom Resource is generated using kubebuilder, and by adding the following comments we can enable the scale sub-resource:
//+kubebuilder:subresource:scale:specpath=.spec.count,statuspath=.status.count,selectorpath=.status.selectorThis indicates .spec.count of the ScalableElasticsearchNodeSet above is the target for operations using HPA or the kubectl scale command, and the current count is recorded in .status.count. Furthermore, .status.selector records the selector used to select the managed StatefulSet for this resource. Of course, these are not recorded automatically and you need to implement your own controller to make it happen.
Additionally, the actual number of replicas in the StatefulSet is calculated from the fields count, shardsPerNode, and the shard count of the target index in the spec of this Custom Resource, as follows:
ceil(ceil(count * shardsPerNode / numberOfShards) * numberOfshards / shardsPerNode)In other words, in the case where the shard count is 3 as mentioned earlier, the graph would look like this:
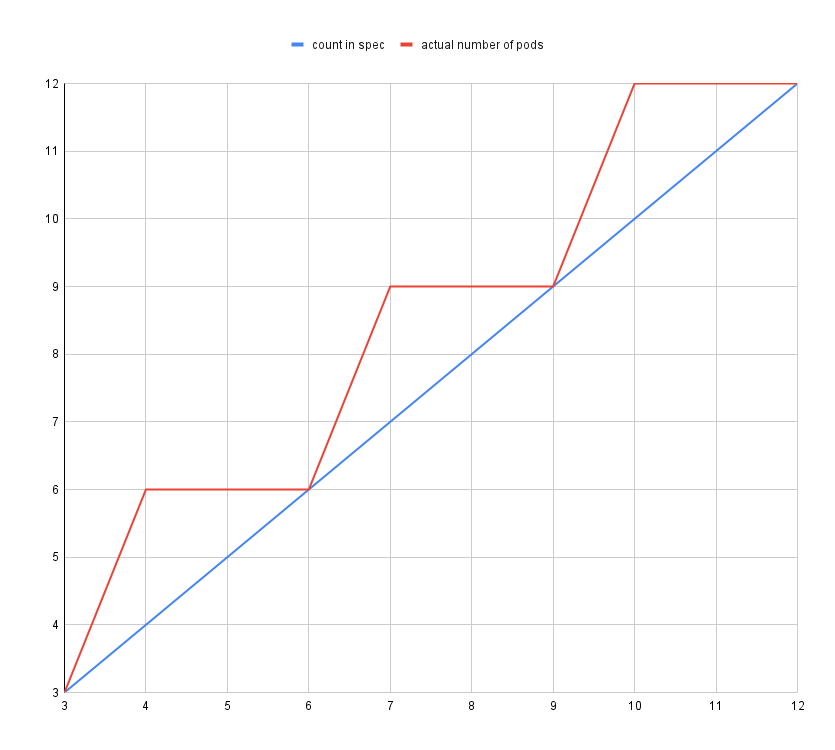
We confirmed by reading the HPA source code that HPA would keep working, even if the .spec.count of the Scale sub-resource did not match the actual count (at least for type: Resource). The current replica count used to calculate the replica count that should be set by HPA is determined by the number of Pods selected by .status.selector.
During scale-out, first, the count of the relevant nodeSet in the Elasticsearch resource is set to the value calculated from the above formula. After all pods have become ready, the replica count of the index is increased using Elasticsearch’s API. Then during scale-in, the replica count of the index is reduced first, before the count of the Elasticsearch resource is changed.
We have thus solved the first two challenges mentioned earlier. As for the third challenge, we will use MutatingWebhookConfiguration to address it. This mechanism allows us to specify hooks that are triggered when the Elasticsearch resource is updated. Within these hooks, we can define annotations like search.mercari.in/ignore-count-change: "data,coordinating". If an annotation corresponding to this pattern is found, we will override the count number of the associated nodeSet with the current count number. By implementing this solution, Elasticsearch resource updates made through GitOps or similar methods will no longer result in a reset of the count number.
Issues Found During Initial Deployment
After implementing a controller based on the above policy, we encountered several challenges, namely:
- Latency increased immediately after scaling out.
- Force merge prevented using CPU utilization as a metric for HPA.
- Metrics used to indicate bottlenecks change when traffic is low.
We will dive into each one in more detail below.
Latency increases immediately after scaling out
We observed this issue from time to time during rolling updates. After the Data nodes started up, and shards were allocated, we could see a significant increase in latency immediately after search requests started being handled. This problem was not limited to Data nodes, but it also occurred in Coordinating nodes (nodes responsible for initial request handling, routing, and merge operations) after Istio was introduced to the microservice that sent requests to Elasticsearch.
The cause is likely related to the “JVM cold start” issue. In the case of using Istio, the Istio sidecar immediately started to evenly distribute load to the newly added Pods, which were still not quite ready. This was not an issue prior to using Istio, as HTTP keep-alive allowed for a gradual migration of traffic to the newly added Pod.
To address this challenge, we employed techniques such as passthrough (directly passing requests without relying on Istio’s service discovery) or setting a warmupDurationSecs in the DestinationRule (gradually increasing traffic to the new Pod over a specified period). However, for Data nodes, routing is solely dependent on Elasticsearch, leaving no room for external intervention. Therefore, we decided to modify Elasticsearch itself to resolve this issue. We have submitted a Pull Request to the upstream (https://github.com/elastic/elasticsearch/pull/90897).
Force merge prevented using CPU utilization as a metric for HPA
We performed force merges during low traffic hours to purge logically deleted documents, as our indices received a high number of document deletions and updates (internally, Lucene which powers Elasticsearch performs atomic deletions and additions to update a document)This was necessary as it led to severely degraded performance several days later if we forgot to perform a force merge.
However, force merging is a CPU-intensive process and is not suitable to be performed at the same time as scaling out. Therefore, we could not use CPU utilization as the metric for Horizontal Pod Autoscaler (HPA). We initially considered using the number of search requests as an external metric via Datadog. However, the query patterns and workload characteristics changed drastically depending on which microservice was calling our ES clusters, which made CPU utilization the best metric for HPA.
While reviewing the Lucene source code, we discovered an option called "deletes_pct_allowed". This option allows specifying the percentage of logically deleted documents, with a default value of 33. During performance testing with different values, we found that latency deteriorated significantly around 30%. Therefore, by setting this value to the minimum of 20 (default 20 in the latest Elasticsearch, with a minimum of 5 in https://github.com/elastic/elasticsearch/pull/93188), we were able to eliminate the need for force merges. Consequently, we were now able to use CPU utilization as the metric for HPA.
Metrics used to indicate bottlenecks change during when traffic is low traffic
In Elasticsearch, low latency is achieved by leveraging the file system cache to store the contents of the index. We aim to load all necessary information in the file system cache, and this means that a significant amount of memory is required for large indexes. During high-traffic hours, the bottleneck is typically the CPU; and thus using CPU utilization as the metric for Horizontal Pod Autoscaler (HPA) allows for effective autoscaling.
However, even during extremely low-traffic periods, it is essential to maintain a minimum number of replicas for availability. During these times, the bottleneck is memory, and allocating an excessive amount of CPU to fulfill the necessary requirements results in a lot of wasted (unused) resources.
The original configuration was set in a way that the amount of memory allocated was twice the size of the index on disk, and the memory.usage metric indicated high values. However, upon examining memory.working_set, it was apparent that there was still plenty of headroom. In Kubernetes, memory.working_set is calculated by subtracting inactive files from memory.usage. Inactive files roughly refer to the size of infrequently accessed file system cache. In Kubernetes, these file system caches are evicted before reaching the memory limit of the container. Consequently, it became clear that we could get away with allocating less memory.
While it is true that active file system caches can also be evicted, evicting them excessively would lead to performance degradation. The challenge lies in the fact that the conditions for files to transition from inactive to active are relatively loose, making it difficult to determine the extent to which eviction is possible explicitly. As a result, we could not aggressively lower the value for memory request. However, this approach allowed us to reduce the total CPU requests during timeframes where memory was the bottleneck.
It is difficult to apply a VPA that requires a Pod restart to Elasticsearch, as it is a stateful application. However, with the availability of In-place Update of Pod Resources (https://kubernetes.io/blog/2023/05/12/in-place-pod-resize-alpha/), it will be possible to scale down CPU requests without restarting, so we can expect this issue to be alleviated.
Final thoughts (We are hiring!)
In this article, we discussed how to use Horizontal Pod Autoscaler (HPA) to autoscale an Elasticsearch cluster running on Kubernetes with ECK based on CPU utilization. This resulted in approximately 40% reduction in Kubernetes costs related to Elasticsearch operations. We anticipate that in the future, Elastic Cloud will likely provide similar autoscaling features as part of its Serverless offerings. However, in our current situation, we find this method to be effective.
The search infra team is currently looking for colleagues to join us. If you are interested, please feel free to contact us at Software Engineer, Search Platform Development – Mercari.