* This article is a translation of the Japanese article written on December 12, 2018.
—
Hello, I’m @urahiroshi from the frontend team. I wrote an article day 12 of the Mercari Advent Calendar 2018.
We held an internal reading circle of "Super Speed! Web Page Speed Improvement Guide (Japanese book)" from August to December 2018 with front-end team volunteers from Mercari and Merpay. The phrase "Don’t guess, measure" is introduced in this book. I will introduce the performance measurement and simple analysis of Mercari website using Chrome DevTools, based on this phrase and using the knowledge learned in the reading circle.
Note that the project to replace the architecture of the Mercari website is currently underway, so the performance values measured in this article may change drastically. One of the purposes of writing this article is to enjoy how much the numbers have improved after the replacement of the architecture.
Measurement methods and environment
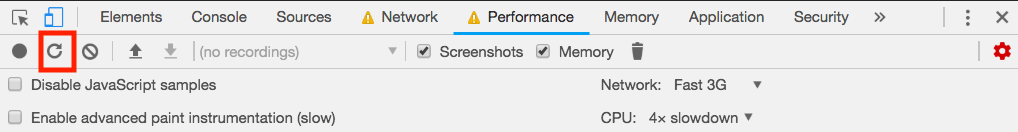
The measurements were taken using the Performance panel of DevTools in Google Chrome 71.0.3578.80. Since the specs of an engineer’s PC and the network environment are high compared to smartphones, the results may be different from normal user experience if measured as is. Therefore, in this measurement, we selected Network: Fast 3G and CPU: 4x slowdown in the Performance panel to simulate the environment with slowed down CPU and network.

Clicking the Start profiling and reload page button (the button with the red frame) in the above figure will start profiling the currently displayed page.
Although I will not introduce it here, you can also measure performance using Lighthouse and refer to hints for performance improvement by running Run audits in the Audits panel instead of measuring in the Performance panel. By clicking View Trace on the page after running Audits, you can also refer to the information in the Performance panel, so if you want to compare your measurements with First Meaningful Paint or other indicators, I recommend you to use the Audits panel.
Overview section
When the measurement is finished, the measurement results will be displayed in the Performance panel. At the top of the Performance panel, we can see the Overview section that there are FPS, CPU, NET, Screenshot, and Heap items.

The details of each item are as follows.
FPS
FPS stands for Frame Per Second. The faster the change, the larger the value on the vertical axis, indicating that the screen is being updated in a shorter time. The higher the number, the smoother the action and the faster the response time.
A typical display refresh rate is 60FPS (refreshing a frame at about 16.7ms). Even if we increase the FPS of the website to more than 60FPS, the display speed of the monitor will be the next problem. Therefore, 60FPS is one target value.
CPU
The height of the graph indicates the CPU load, and the color indicates the type of CPU processing (described below). The shaded areas indicate processes other than the main thread.
- Blue (Loading): Processing of HTTP requests and HTML parsing
- Yellow (Scripting): JavaScript processing
- Purple (Rendering): style evaluation and layout calculation
- Green (Painting): Paint processing and image rasterization (bitmapping)
- Gray: Other
NET
NET shows the communication status of the network. Dark blue indicates a request to a high priority resource, and light blue indicates a request to a low priority resource.
Regarding the priority of resources, HTML, CSS, etc., which are essential to the composition of a web page, are treated as high priority by browsers, while images, etc., are treated as low priority. In addition, the priority can also be controlled by HTML definitions such as rel="prelaod" in the <link> element for content prefetch, or using HTTP/2 by client side (Priority Hints is under development).
Screenshot
It shows a screenshot at the time, which can be enlarged by hovering the mouse over it.
For measurements that run Start profiling and reload page, the screenshot of the web page before reloading is displayed first, that is a bit confusing.
Heap
This shows the memory usage of the JavaScript heap area. In this article, we will focus on the network and CPU processing, so I will not explain the details.
Detail section

When I select the range to see the details of in the Overview section, the Detail section (Network, Frames, Interactions, Main, Raster, GPU, ScriptStreamer thread) will display the details for that time period. In this article, I will mainly refer to the Network and Main (main thread) processes, so let’s first check the meaning of the contents displayed in those sections.
Network

We see bar graphs of various colors, and these are color-coded by resource type, as follows.
- Blue: HTML
- Purple: CSS
- Green: Image
- Yellow: JavaScript
- Gray: Font
The bar graph starts with a gray line and ends with a light-colored rectangle, a dark-colored rectangle, and a gray line in that order.

This shows the stages of the network process as follows.
- Gray line on the left: Shows the time it takes to send the request. If it takes a long time to connect to the server, or if other high-priority processes interrupt, this time will be longer.
- Light colored rectangle: Indicates the time it takes to send a request and receive the first data (called TTFB = Time To First Byte). It is affected by the processing time of the server, the state of the network path between the client and server, and the physical distance.
- Dark rectangle: indicates the time it takes to receive all the data from the TTFB. The larger the size of the data, the longer the rectangle will be.
- The gray line on the right: shows the time it takes for the main thread to process the data after receiving it. If the main thread is executing other processing, this time will be longer.
You can also see a small rectangle in the upper left corner of the bar graph. This indicates the priority of the corresponding resource, and the darker the color, the higher the priority.
The TTFB of the first requested HTML (blue bar) cannot be confirmed, but this is probably because the information is not displayed during the time when the measurement has just started. We can check the details by selecting the target resource in the Network panel and referring to the Timings tab.

The TTFB is 569.14ms. Also we can see the processing times of "DNS Lookup", "Initial connection", and "SSL" before the request is sent. When the client sends a request to the server, the following network processes are executing, which correspond to the processing time.
- DNS Lookup: The process of querying a DNS server to retrieve an IP address from a domain name.
- Initial connection: Establish a TCP connection to the server with the IP address retrieved in #1.
- SSL: Establishes an SSL connection after establishing a TCP connection (only HTTPS).
These processing times are not only related to the performance of the client or server, it also related to the physical distance between the client and server, since several round trips are made between the client and server. If the server is out of the country (or even if it is in the country), each round trip will take several 10ms or more, and no amount of performance enhancement can reduce this time.
In the case of Merkari Web, the client does not communicate directly with Merkari servers. We use a CDN (Content Delivery Network) to deliver resources. The CDN has a number of servers at many physical locations, and since the client can communicate with the server at the closest location, the time associated with physical distance is relatively short.
Also, by using HTTP Keepalive, once a TCP connection is established between the client and the server, the connection can be reused for a while.

The image above indicates the network process requesting CSS after the request for HTML. In the image, the DNS Lookup, Initial connection, and SSL processes are not executed and the request can be sent immediately.
Main

Each processing time of the main thread is displayed, color-coded according to the type of processing. This color coding has the same meaning as in the Overview section, so please refer to the explanation there (also in the Summary tab).
This time, since the Disable JavaScript samples checkbox was unchecked during the measurement, the call hierarchy of JavaScript methods is displayed in the script processing section, making it easier to analyze which processes are taking time. However, if this check is unchecked, the load when measuring performance will increase. So if you want to get values more in line with the actual situation, I recommend it to be checked.
In addition, the Summary tab at the bottom shows the time spent on each process in a pie chart. This is useful to identify how much load (percentage other than Idle) and what processes are heavily loaded during the selected time range.
Requesting HTML and other resources
Now, let’s check the status of each time zone by dividing the time zone in the Overview section. The first step is to download the HTML and the resources that the HTML refers to.

After downloading the HTML, the main thread is executing the process (Figure (1)). This is mainly an HTML parsing process, and while the size of the HTML is 517KB before compression, it took about 65ms to process(Summary tab).
In parallel with this process, various resource requests are being processed. There is a little wait time for the image file request (Figure (2)). Because Those image files are stored in a different domain of URL, and requires processing time for DNS Lookup, Initial Connection, and SSL connection.
Downloading and rendering CSS

After the CSS is downloaded (Figure (1)), the main thread executes the CSS parsing(about 32 ms, Figure (2)), rendering (about 406 ms, Figure (3-1) and (3-2)), painting (about 28 ms, Figure (4)), and then the frame is updated. The rendering process is splitted into two parts: Recalculate Style (about 71ms, Figure (3-1)) and Layout (about 334ms, Figure (3-2)). Recalculate Style is the time to apply the style information to the elements that match the CSS selector, and Layout is the time to calculate where each element will be placed based on the style information.
In this case, the starting point is to download the main CSS file. However, when dynamic style changes are made in JavaScript, layout recalculation may become necessary. In particular, if layout information is referenced and updated frequently, such as in loop processing, a condition called Layout Thrashing may occur in which excessive layout recalculation occurs. In such a case, it may be necessary to review the process by consolidating the timing of reference and update.
Downloading and executing JavaScript

After the JavaScript file has been downloaded (Figure (1)), the main thread executes the scripting process (Figure (2)). Downloaded resources such as image files in parallel, but since the main thread is focusing on the scripting process, it takes time for the downloaded resources to be passed to the main thread.
In the details of the main thread, the processing time is shown for each level of script invocation, which can be used to investigate the bottleneck of long processing time. Also, by clicking on the Evaluate Script section of the main thread and selecting the Bottom-Up tab from Summary, the methods are sorted by the longest processing time.

Merkari Web uses a library for SPA (Single Page Application) to read and write HTML DOM elements immediately after JavaScript is downloaded. So, the script processing load is large until the first screen is displayed.
By using SSR (Server Side Rendering) frameworks such as Next.js, the load on the first access may be reduced because the HTML on the first access can be generated and returned on the server side. Although it may increase the TTFB to the increased processing load on the server side, it may be effective especially for low-spec clients.
Download various resources

After the JavaScript scripting process, the font and image files are downloaded, and the frame is updated accordingly (Figure (1)).
However, the layout process is executing frequently in the main thread ((2) in the figure), and the rendering process cannot be executed during this time. As a result, frame updates are slow. It could be pointed out to require a refactoring of JavaScript.
Downloading image

It is taking a long time to download in a slow network environment, because the image file size is large, (8.89 seconds for the largest file of 699KB, Figure(1)).
The first way to deal with the size of image files is to improve the compression format and compression ratio of the images.
Also, if the user screen size is small, they may be downloading too large sized images. Therefore, an effective method is to change the image size according to the user screen size.
The Web browser can select the best image according to the resolution of the display, the width of the image, and the supported image formats by using the srcset attribute for the img element, the picture element, and the source element in HTML.
In addition, a standardized specification for sending client information in the HTTP header and having the server return the appropriate resources has been proposed as HTML Client Hints. Note that only Chrome is currently supported.
We can also use Preload to prefetch resources if we want to give priority to the images to display.
Conclusion
I think we have been able to visualize what kind of resources and processing lead to the decrease in display speed.
However, if we measure the results on our own PC terminal, the network environment and the processing load on our PC terminal may depend on the conditions at the time, or may differ from the results measured by other people. Therefore, optimization based on the results measured on a personal terminal has the risk of leading to wrong optimization.
There are two types of monitoring methods, Real User Monitoring and Synthetic Monitoring, that can be used periodically to measure and compare performance.
-
Real User Monitoring: This is a monitoring method used to obtain statistical information on "actual user performance" by executing a script to measure performance on the client side, and sending and aggregating the results. It can obtain statistical data that matches the actual situation, but on the other hand, individual data will vary depending on the user’s environment. It also has the disadvantage of increasing the processing load by the script itself, since the script is executed on the client side.
-
Synthetic Monitoring: This is a monitoring method that sends requests periodically from cloud services and measures their performance. Since the requests are sent from the same environment, there is less difference between the data that can be obtained, making it easier to use as a reference value for performance. On the other hand, if there is a difference between the execution environment and the user’s environment, it may return results that do not match the actual situation.
The ideal flow would be to use these measurements to detect performance degradation, analyze the details using Chrome DevTools, and then identify and handle the performance bottleneck.
Much of what I’m introducing in this article can be found in detail in "Super Speed: A Guide to Improving Web Page Speed (in Japanese)". If you are interested, please read the book.
So, @pospome will be written on day 13 of the Mercari Advent Calendar 2018 tomorrow. Please continue to enjoy it.