Hi, I’m Anirudh, a Platform Infrastructure Engineer at Mercari.
At Mercari, we depend heavily on GitHub for all of our CI pipelines. We manage our own self-hosted runners using GitHub’s Actions Runner Controller (ARC) which are deployed on a standard Google Kubernetes Engine (GKE) cluster.
In this article I’ll be sharing how we made our CI 30-to-40 % faster by fixing the scheduling and caching problems of container jobs on GitHub ARC. Along the way I’ll cover why the community’s answers did not work for us and what we built instead using core Kubernetes primitives.
Every job paid the full image pull
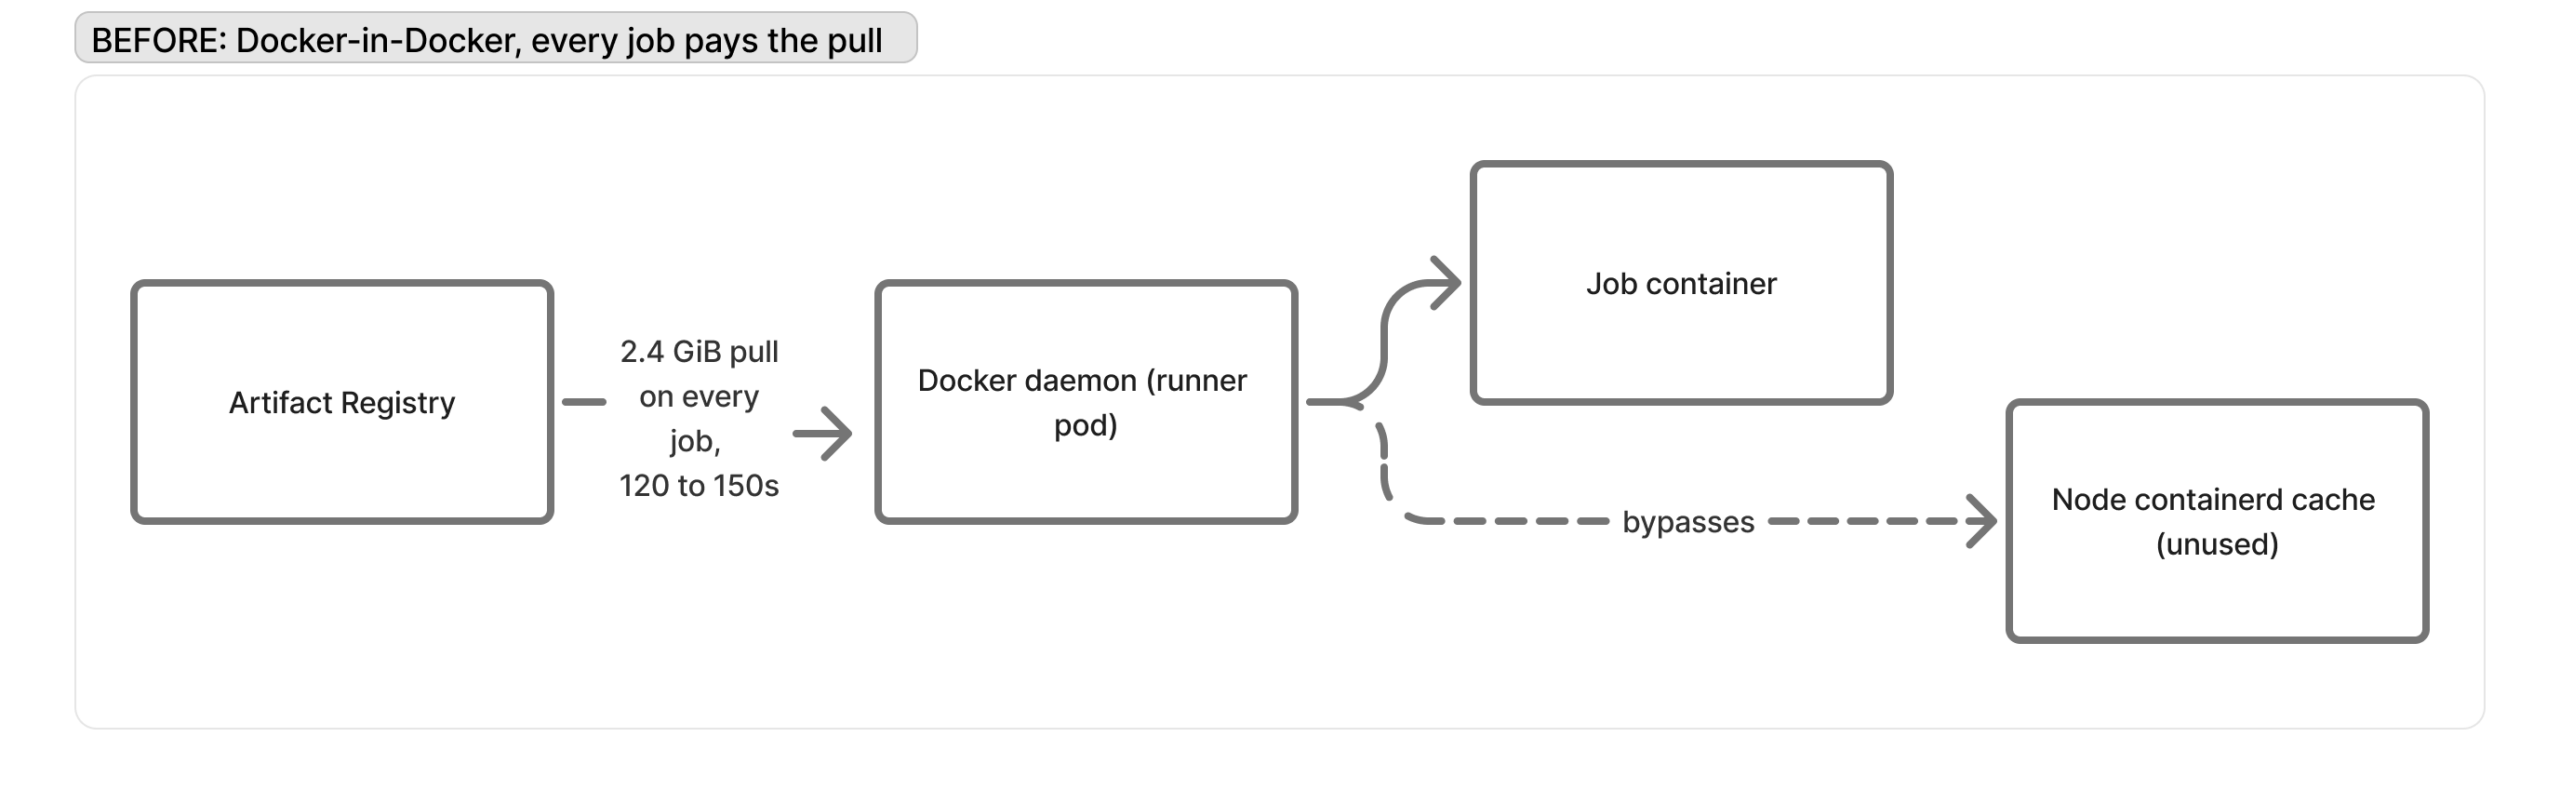
A container job, as the name suggests, runs its steps inside a container. What "container" means depends on which mode the ARC runner is configured in. At Mercari, all of our runners ran in Docker-in-Docker mode, which means every runner pod carries two containers. The first is the runner container, which talks to GitHub and receives the job. The second is a Docker daemon, sidecar to the first, and the job’s container runs inside that daemon rather than as a pod of its own.
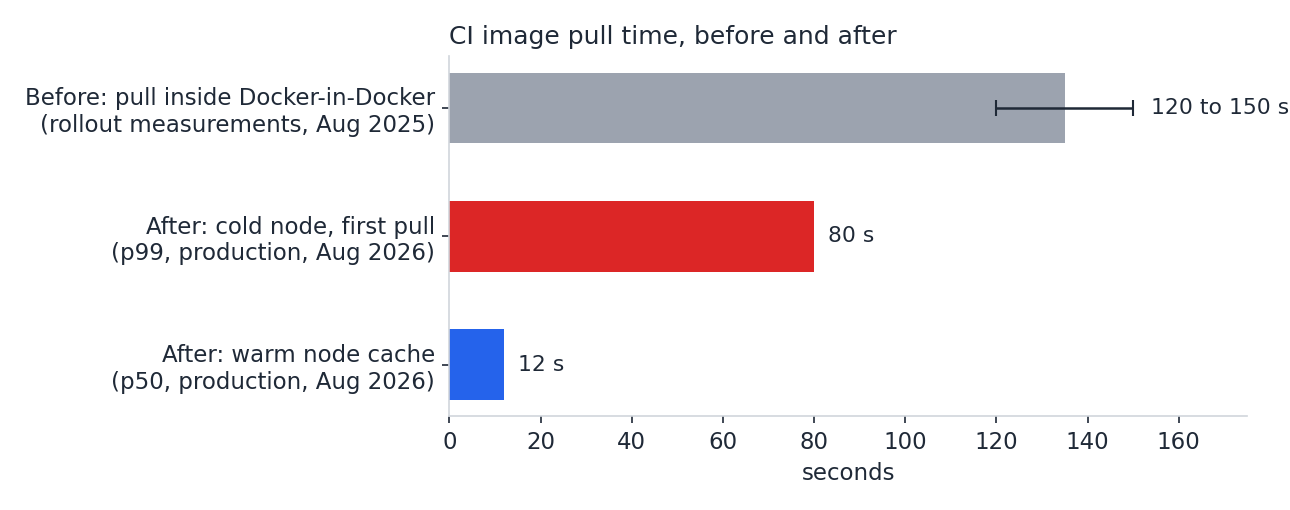
One of our busiest CI pipelines belongs to an IaC monorepo which applies infrastructure changes to our cloud. Every job in that pipeline is a container job running on a 2.4 GiB image. An image that size makes a slow start almost certain, and ours was SLOW. 2-to-3 minutes of downloading and extracting layers, unpacking to roughly 8 GiB, before the first instruction ran. For a job that lasts 6 to 7 minutes, the pull was the obvious place to start. Across a month of runs, that cold start alone cost us well over 900 hours of CI time.
The 3 families of fixes we dropped
Initially we explored two kinds of fixes:
- Rightsizing the image – If the image size is the problem, the obvious fix is a smaller image. That was not an option for us though. The image carries a number of our internal tools, and shrinking it would have meant dropping some of them, which would have pushed complexity into the pipeline instead of removing it.
- Moving bytes faster – We deployed docker-registry-proxy as a pull-through cache and ran the pipeline against it. Download time fell by 70-to-80 %, and yet the job only sped up by ~15 %.
When we investigated why a faster download did not improve startup, we found that downloading accounted for only about 20 % of the 2 to 3 minutes. The rest went to extracting those downloaded layers. It made us change our strategy from moving bytes to keeping the bytes, which led to a third idea, still on the DinD runners.
- Caching – keeping the bytes means caching the bytes, but ephemeral runners do not cache anything, so we mounted a persistent disk on the runners, sharing only the image layers with each other. This reduced the startup time by 80%.
The persistent-disk cache had a problem of its own. A GKE persistent disk is ReadWriteOnce (RWO), so it attaches to one node at a time. Sharing it across runners that scale up and down with traffic would have needed ReadWriteMany (RWX) storage, and on GKE that meant a managed file service or a machine family we were not running, both at a cost that dwarfed the problem.
So we dropped the persistent disk idea and looked for other ways to keep the image layers available for runners. This led us to implement our first version of the solution.
Kubernetes mode lets the node do the caching
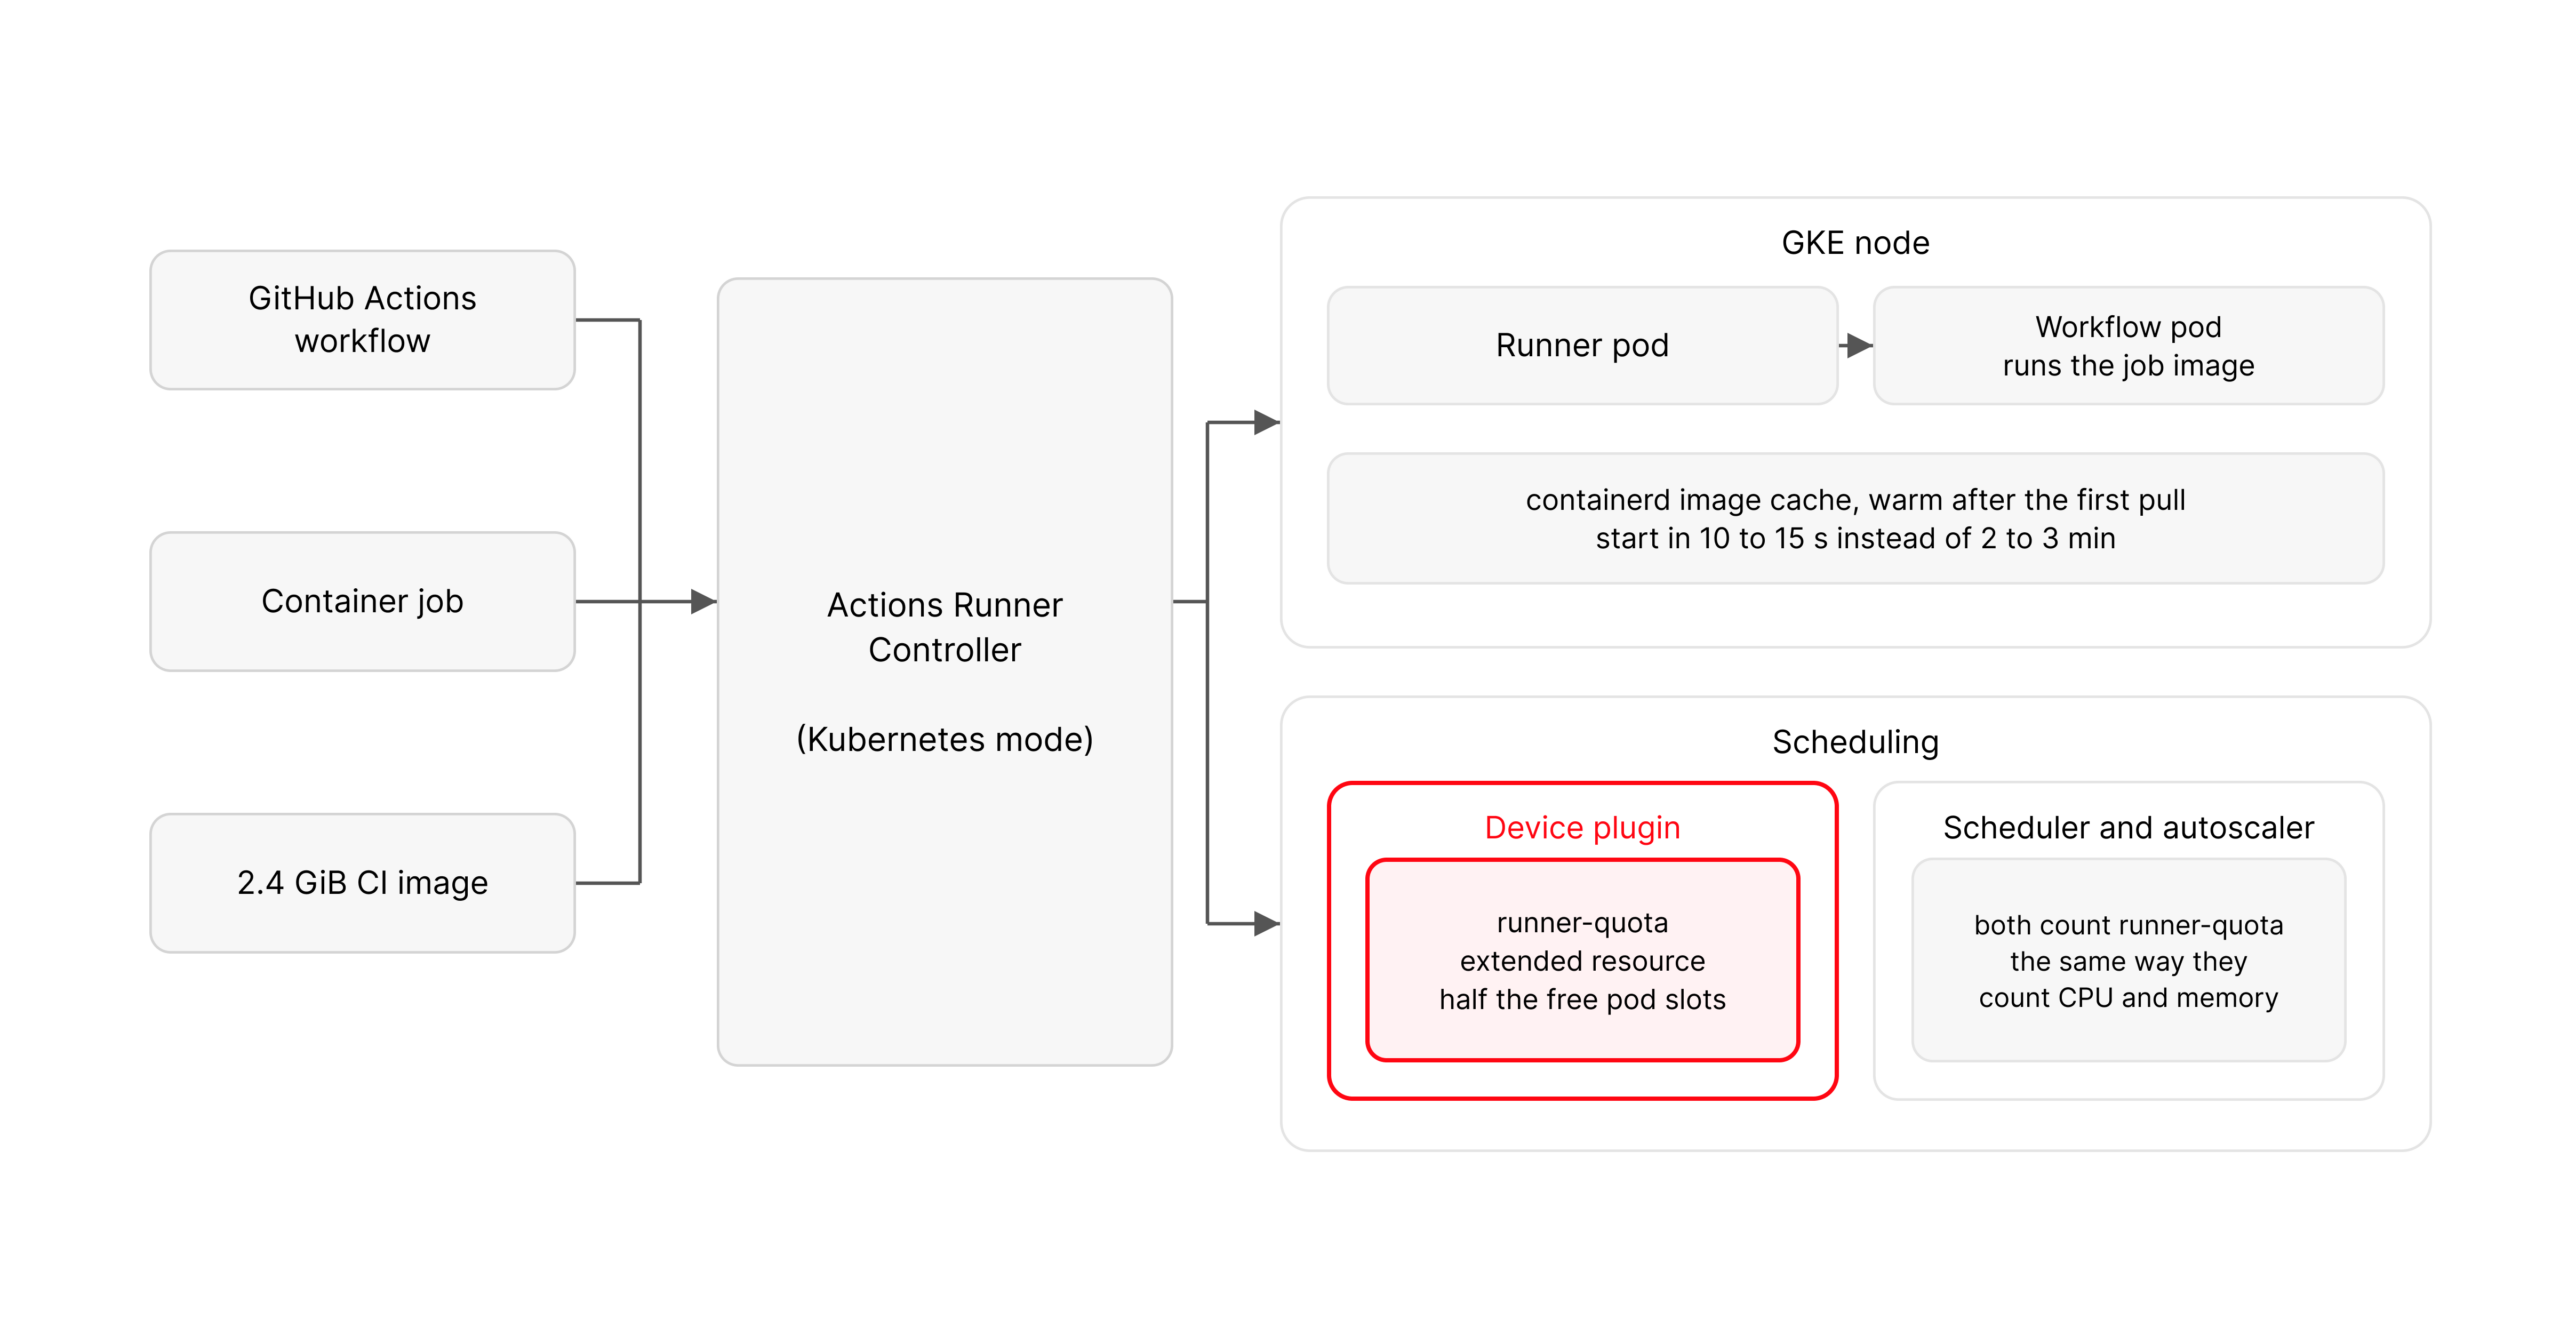
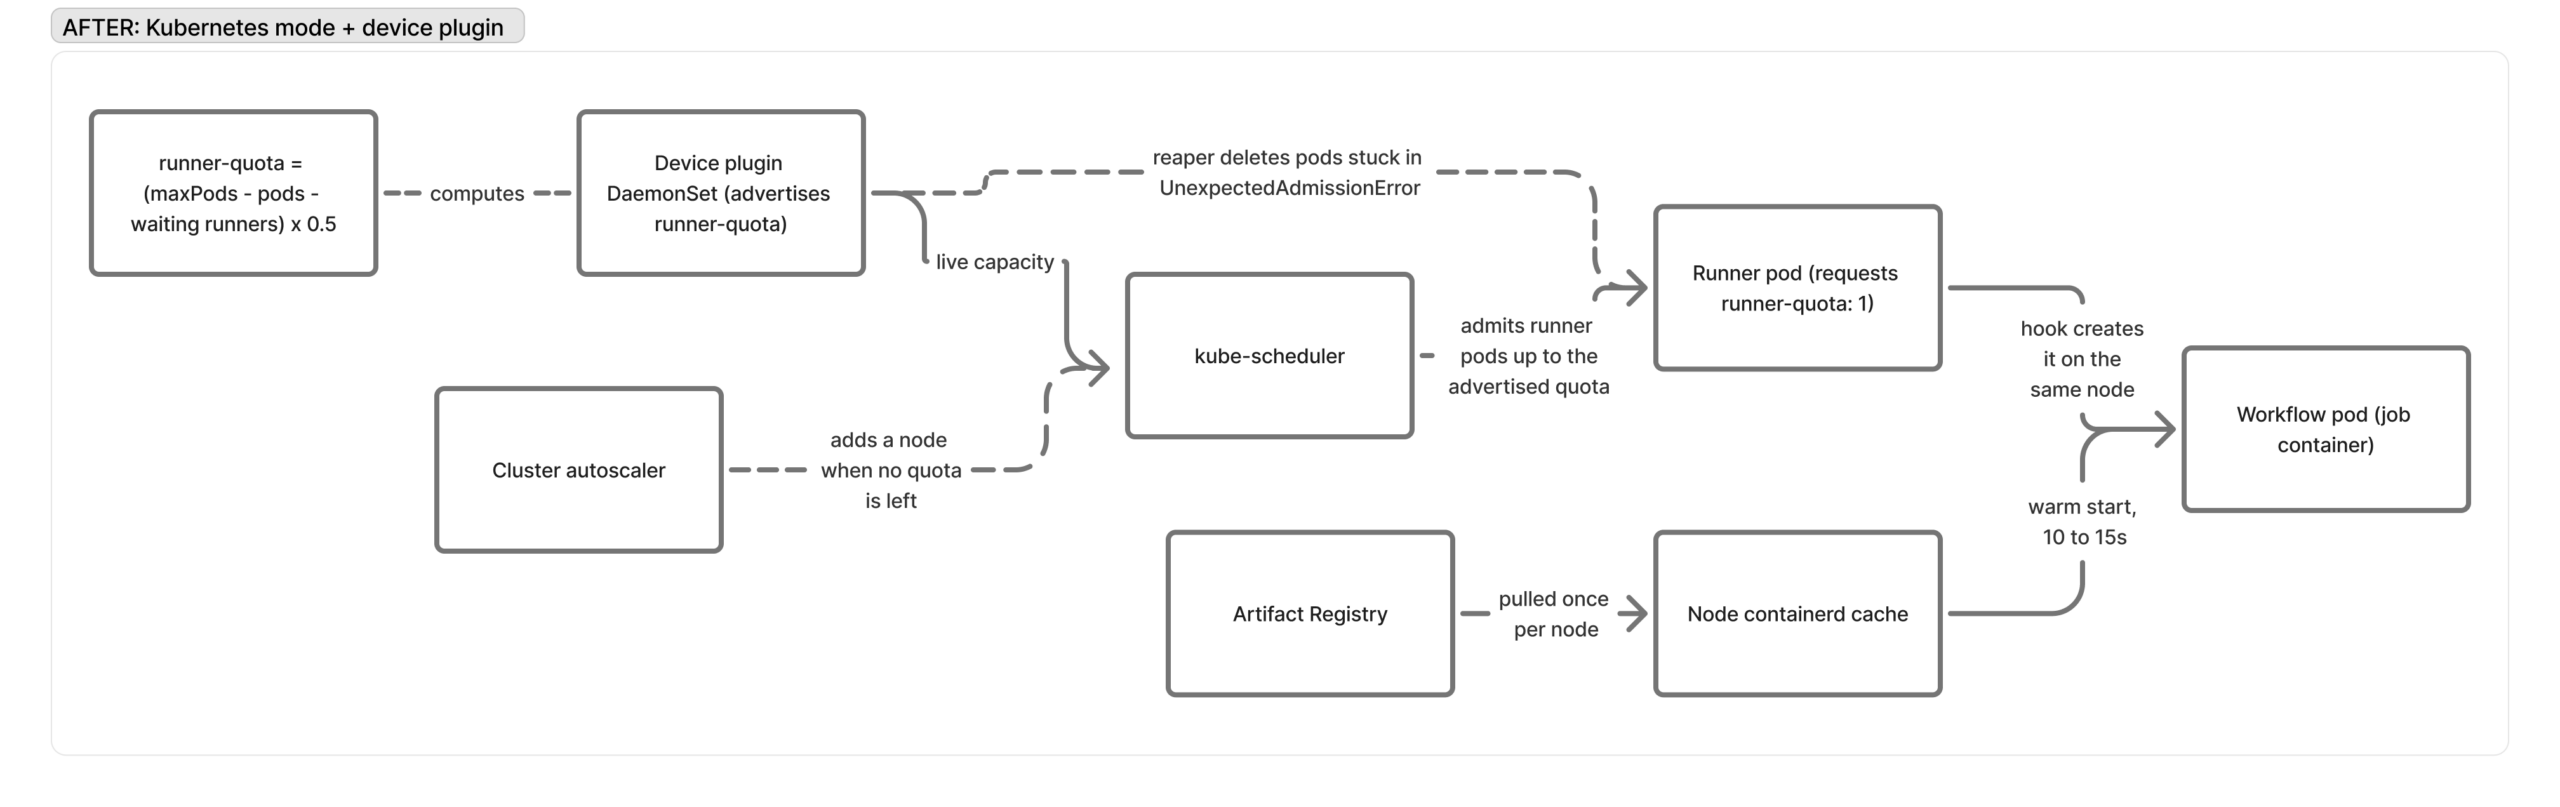
The answer turned out to be ARC’s other runner mode, Kubernetes mode. In Kubernetes mode a container job runs as a pod of its own rather than inside a Docker daemon. The runner pod stops executing CI steps and only listens for jobs, calls GitHub, and streams logs back. For the actual work, it spawns a second pod on the same node, the workflow pod, and the two share an ephemeral volume that carries the job’s workspace between them.
That removed our storage problem entirely. Because the workflow pod is a real pod, the node’s container runtime stores its image layers the same way it does for any other pod. The first job on a node pulls the image once. Every job after that starts from the layers already on disk, and only a freshly provisioned node ever pays for a download.
We created a dedicated AutoscalingRunnerSet configured for Kubernetes mode and tested it in our laboratory environment. The results were what we had hoped for. Startup time fell by 80-to-90 %, down to 10-to-15 seconds. But production told a different story. As concurrency climbed, jobs started failing with a single error, "pod failed to come online". Within days it had taken down the first version of our solution.
The OutOfPods deadlock
Digging into the "pod failed to come online" error, we found the error propagated from the kubelet rejecting workflow pods with `OutOfPods`, which it does when a pod arrives at a node that has already reached its pod capacity.
We discovered that Kubernetes mode carries a constraint that was invisible to us at low volume. The volume shared between the runner pod and its workflow pod is ReadWriteOnce, which means both pods must land on the same node, and the hook enforces that placement in a way the scheduler never gets to see.
runner-container-hooks is the set of scripts that make it possible for ARC to manage container jobs. They hold the logic behind the creation, deletion and scheduling of the workflow pods.
By design, the hook places a workflow pod on the same node as its runner pod. It does this by setting the workflow pod’s `spec.nodeName` to the runner’s node, and a pod created with `nodeName` already set never goes through the scheduler. The pod goes straight to that node’s kubelet for admission and if the node has already reached its pod capacity, the kubelet rejects it with an `OutOfPods` error.
This is a well known issue and the upstream project has tracked this failure since October 2023, when runner-container-hooks#112 described it almost exactly.
Why standard scheduling fixes didn’t work
The community has experienced this issue and documented a fix. It set an environment variable, `ACTIONS_RUNNER_USE_KUBE_SCHEDULER=true` , so the cluster scheduler places the workflow pods, and it backs the shared volume with RWX storage.
Why this didn’t work for us? Well, as I mentioned before, our whole k8s infrastructure is deployed on GKE, we predominantly use T2Ds virtual machines for cost and performance reasons. GKE doesn’t have any RWX persistent disk storage for T2Ds except slow NFS and the new generation costlier machines which supports them have limitations of being shared with a small number of VMs. With hundreds of jobs a day running on a fleet that scales with demand, we would have been back to partitioning storage across node groups, the same problem the RWO cache had.
The teams that did take that route, with NFS-backed ReadWriteMany volumes, ran into problems of their own. One found that RWX on Azure Files NFS pushed workflow-pod startup to 2 to 3 minutes (hooks#207), and a second report describes the same slowdown (ARC#3834). Another had EFS-backed runners sit in Pending the moment a job added a container (ARC#3885). A third found that `GITHUB_ENV` stopped propagating between steps once the two pods landed on different nodes (hooks#210). A further thread reaches the same verdict on RWX in general (ARC#3673).
Therefore we tried some of our own solutions. We explored topology spread constraints but soon realized that they might spread the runner pods leaving space for workflow pods per node, but during high demand, they would still fill the nodes with runner pods and cause the `OutOfPods` error again. The second solution was to write our own custom scheduler for these specific pods. We used simple arithmetic to schedule runner pods leaving ample space for upcoming workflow pods:
allocatable_pod_count = (maxPodsPerNode
               - podsOnNode
               - runnerPodsAwaitingTheirWorkflowPod) * 0.5
allocatable_pod_count = remaining space for runner pods ; maxPodsPerNode = node’s pod capacity ; podsOnNode = current number of pods on node ; runnerPodsAwaitingTheirWorkflowPod = count of runner pods without workflow pods
The factor of 0.5 is central to the design. Every admitted runner pod will create exactly one workflow pod on the same node, so the formula holds half of the remaining slots for pods that do not exist yet.
This prevented `OutOfPods` error but there were still issues with scaling. The scheduler did leave space for workflow pods but during high traffic, when it tried to schedule new runner pods, it failed as there was no space left on available nodes. What happened in the background was — cluster autoscaler runs its control loop and simulates the compatible scale-up option for the `Pending` pods. It found that there are already nodes with enough resources with pods remained in Pending, and concluded that scaling these nodes won’t help. This made the `Pending` runner pods wait for already scheduled runner pods’ workflow pods to initialize, critically increasing the CI wait time.
That failure showed us the deeper problem. The intent that a workflow pod needs to be created by a runner pod on its own node is either visible to the scheduler or the autoscaler, never both. So we implemented a solution that did exactly this.
A device plugin for a resource that does not exist
Now that we knew how to make space for the pods, we just needed to solve the cluster autoscaler issue to scale up nodes on the basis of runner pod count. Instead of CPU, memory, or GPUs, the pods themselves had to become a resource. That is where device plugins come in.
Kubernetes device plugins advertise specialized hardware (like GPUs) as extended resources beyond CPU and memory. Because Kubernetes doesn’t verify physical hardware, any compliant DaemonSet can advertise arbitrary extended resources.
We reused the same formula that we used with our custom scheduler to advertise the remaining pod capacity as a resource called <code>mercari.com/runner-quota</code> , where 1 unit equals 1 runner pod. The runner set then requests 1 unit per runner:
# AutoscalingRunnerSet pod template
spec:
  containers:
    - name: runner
      image: ghcr.io/actions/actions-runner:2.327.1
      resources:
        requests:
          mercari.com/runner-quota: 1
        limits:
          mercari.com/runner-quota: 1
      env:
        - name: ACTIONS_RUNNER_PREPARE_JOB_TIMEOUT_SECONDS
          value: "600"
After that, the behavior follows directly. The scheduler packs runner pods only as deep as the advertised quota allows. Once no node has quota left, the current fleet cannot satisfy the pending request, so the cluster autoscaler provisions the required nodes. The DaemonSet lands on the new node and starts advertising there.
With this, we faced one small race condition. Occasionally, capacity updates lag changes in node state, the scheduler places a runner against stale numbers, and the kubelet rejects it with `UnexpectedAdmissionError`. The fix here was simpler. We used the same DaemonSet that advertises `mercari.com/runner-quota` to watch for any runner pod stuck on that error and delete it, allowing it to reschedule and work as expected. This closed the last gap and we could finally measure what the cache was worth.
Results and trade-offs
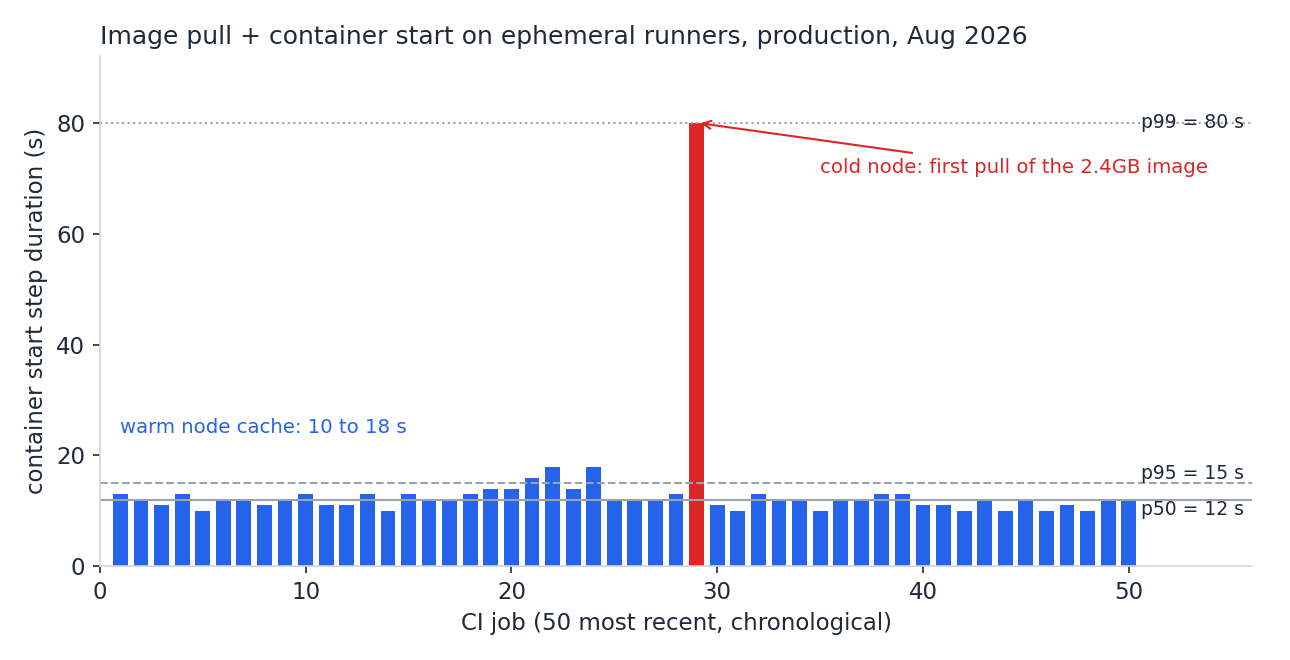
We rolled it out to our lab environment again, and this time we stress tested it before anything else. Image pull time fell from 2 to 3 minutes to 10 to 15 seconds, and pipeline time dropped by 30-to-40 % even at high concurrency. One case stayed slow. The first job on a freshly provisioned node still had to pull the image. We shrank that window considerably by keeping a minimum number of idle runners, which keeps a set of nodes warm between jobs.
The cost was a small amount of idle capacity. The idle runners keep a few nodes running with no work on them. Against the time returned on every job, a couple of lightly used nodes was a trade we were glad to make.
For rollback we kept the old Docker-in-Docker runner set in place throughout. A one-line change in a workflow, pointing `runs-on` back at those runners, would have kept CI running if the new setup broke.
Conclusion
Getting our container jobs to run well on GitHub ARC took us past the usual CI fixes. Every job used to pay a 2-to-3 minute pull before it ran a single step. Moving from Docker-in-Docker to Kubernetes mode successfully shifted the image caching burden from the network to the node. Keeping it fixed in production meant expressing a scheduling demand the cluster could not see, and the device plugin API turned out to be the way to say it. We treated pod capacity as a schedulable resource, which translated our constraint into something the scheduler and the autoscaler knew how to handle.
A warm start now takes around 12 seconds at the median and 15 at the 95th percentile, and our pipelines remain 30-to-40 % faster than when we began. We paid for that with a little per-node density. Our problem was an intent the platform could not see, and the fix was translating that intent into a resource it already manages. Ultimately, this journey proved that the most robust infrastructure optimizations often come from working directly with the tools the system already provides.